
News · Markets · US
After an A.I. Sell-Off, Investors Split Over Whether to Buy
Some fund managers see opportunity after Thursday's rout. Two strategists who have studied earlier shocks say the low may still be ahead.
For information only. Not investment advice. Disclaimer
AI-generated summary, reviewed by the editor.
- The Nasdaq composite closed Friday 10.9 percent below its Oct. 6 record, after falling 5.5 percent on Thursday.
- Simon Webber of Schroders sees opportunities in indiscriminate selling, but names financing as the bigger risk.
- Simon Ree found the S&P 500 closed lower again within 5 weeks in all 3 earlier shocks since 2007 that he studied.
It restates the article and adds no new facts. How we use AI
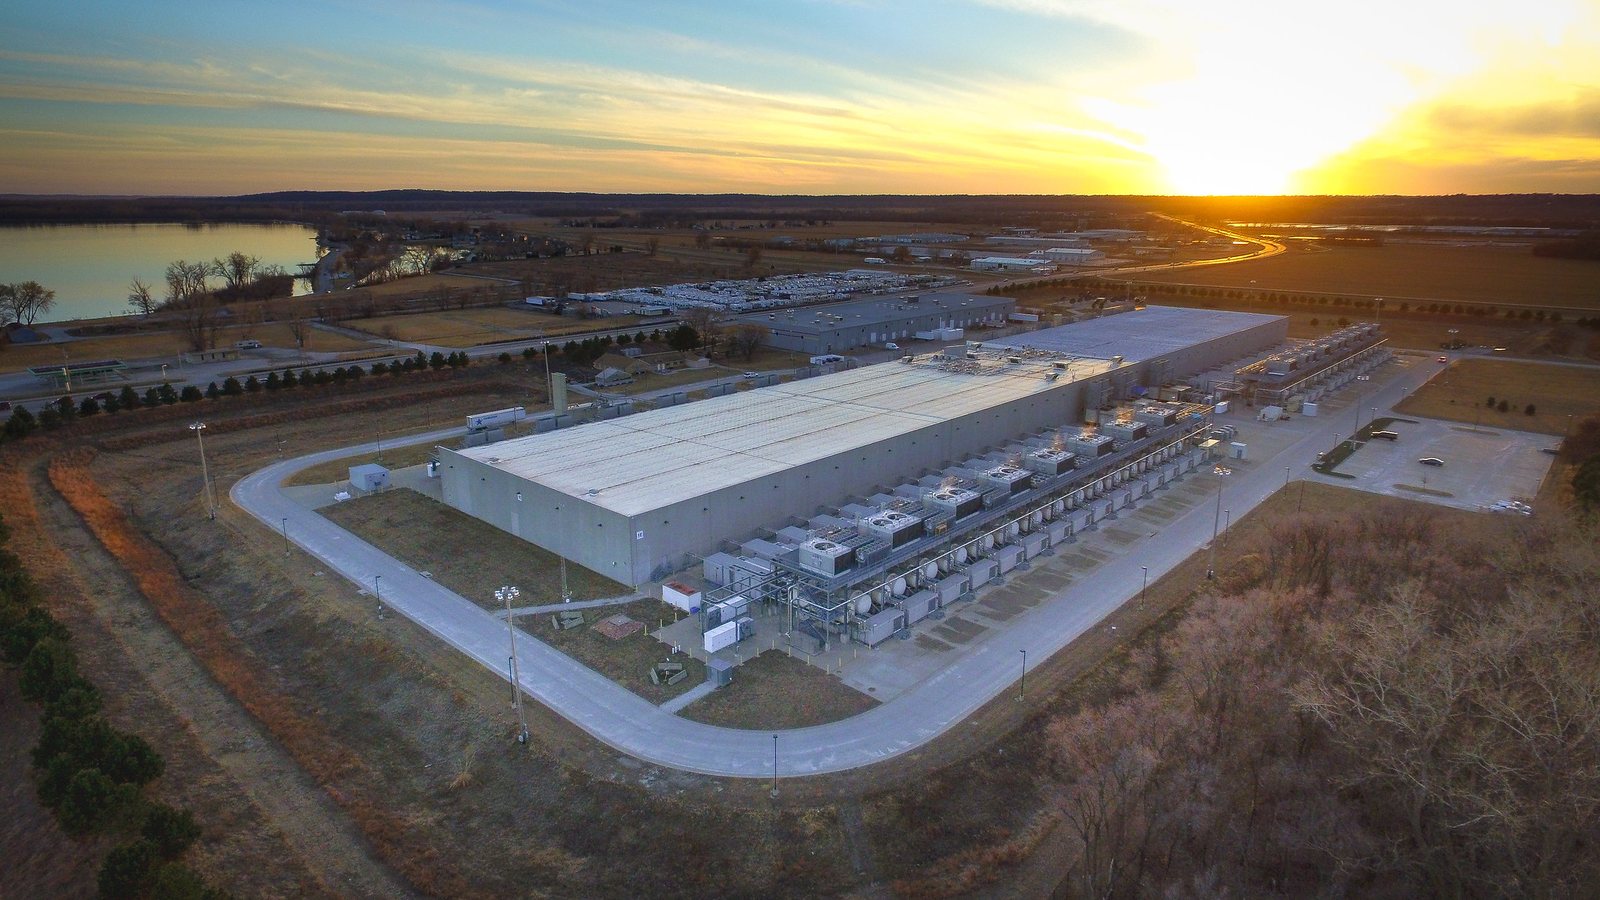
Wall Street had its worst day since the April 2025 “Liberation Day” tariffs on Thursday.
The sell-off came two days after midterm elections that gave Democrats power in states at the center of the data-center build-out.
The S&P 500 fell 4.4 percent, to 7,353.73, and the Nasdaq composite dropped 5.5 percent, closing 11.9 percent below the record it set last month. After Friday’s bounce, the gap was 10.9 percent. Chip stocks took the worst of it. Nvidia, the heaviest weight in the S&P 500, lost 9.3 percent, Advanced Micro Devices lost 17.3 percent, and the Philadelphia Semiconductor Index fell more than 12 percent.
One-day change at the close, %, Nov. 5 and Nov. 6, 2026
View data
| Index or stock | Nov. 5 | Nov. 6 |
|---|---|---|
| Dow Jones industrial average | −3.4% | −0.46% |
| S&P 500 | −4.4% | +0.31% |
| Nasdaq composite | −5.5% | +1.09% |
| Nvidia | −9.3% | +2.8% |
| Philadelphia Semiconductor Index | −12.0%† | +4.2% |
| Advanced Micro Devices | −17.3% | +11.0% |
Closing changes as reported by the sources above; Friday moves for Nvidia, AMD and the chip index come from one source.
The Case for Buying
By Friday, at least one large asset manager had put the buying argument in writing.
“There will likely be significant opportunities created in a market where selling becomes somewhat indiscriminate,” Simon Webber, head of global equities at Schroders, wrote in a note published that day.

Credit: Schroders
The companies at the center of the sell-off have been growing profits faster than the rest of the market.
Earnings at AI infrastructure companies rose 54 percent in the second quarter from a year earlier, against 14 percent for the rest of the S&P 500, according to a September report from BlackRock citing FactSet and Goldman Sachs data.
Simon Ree, an ex-Goldman desk head and author of the book “The Tao of Trading,” went back through three earlier shocks since 2007 in which the S&P 500 fell 3.5 percent or more after starting within 5 percent of a record high. “I ran the numbers, and in all 3 episodes, the index closed lower again within 5 weeks,” he wrote. In all three, it was back above its pre-shock close within two months.
Not the First Scare This Year
A.I. stocks have been here before, and more than once this year.
BlackRock’s fall outlook, published Sept. 1, described a sell-off that ran from June 22 to July 29. The Philadelphia Semiconductor Index moved more than 5 percent in either direction on a third of trading days in June and July, compared with 3 percent of days over the previous decade. “We believe the AI sell-off will fade, but brace for likely elevated volatility,” the firm wrote. The Nasdaq then set the record it now trails, last month, the Associated Press reported.
This comes after a scare over financing in October.
CoreWeave bonds sold in June at a yield of 9.675 percent were yielding 15 percent that week, Reuters reported on Oct. 16. “CoreWeave is absolutely the canary in the coal mine,” Max Frumes, global head of distressed and leveraged finance at the credit data firm 9fin, said to the news agency.
Then came earnings.
Alphabet and Amazon disappointed investors, Reuters reported on Oct. 30. That Friday, Intel fell nearly 29 percent after its own report, the S&P 500 sank 1.8 percent and the Nasdaq fell 2.9 percent.
A Reuters/Ipsos poll released in October found that 69 percent of Democratic registered voters back limits on building data centers, against 43 percent of Republicans. Analysts quoted by Reuters on Oct. 22 doubted that national legislation would significantly stall construction, though they expected scrutiny. “There will be congressional hearings. There will be investigations,” said Brian Gardner, chief Washington policy strategist at Stifel.
In January 2025, the Chinese company DeepSeek set off a global A.I. sell-off, and Nvidia lost about $593 billion in market value in a session, a record for a Wall Street stock, according to Reuters. Its shares fell just under 17 percent, to $118.42. Daniel Morgan, a senior portfolio manager at Synovus Trust Company, called the selling an over-reaction and an “opportunity to add high-quality tech shares on weakness.” This time, Nvidia closed Thursday at $181.60, after a 9.3 percent drop.
Nasdaq composite, daily close, Oct. 1 to Nov. 6, 2026
View data
| Date | Close |
|---|---|
| Oct. 1 | 26,871.6 |
| Oct. 2 | 27,190.86 |
| Oct. 5 | 27,477.31 |
| Oct. 6 | 27,599.89 |
| Oct. 7 | 27,538.69 |
| Oct. 8 | 27,193.34 |
| Oct. 9 | 27,366.17 |
| Oct. 12 | 27,245.9 |
| Oct. 13 | 27,204.38 |
| Oct. 14 | 26,692.87 |
| Oct. 15 | 26,713.03 |
| Oct. 16 | 26,140.03 |
| Oct. 19 | 26,430.89 |
| Oct. 20 | 26,424.82 |
| Oct. 21 | 26,702.86 |
| Oct. 22 | 26,008.86 |
| Oct. 23 | 25,955.34 |
| Oct. 26 | 26,169.38 |
| Oct. 27 | 26,477.81 |
| Oct. 28 | 26,549.85 |
| Oct. 29 | 26,184.72 |
| Oct. 30 | 25,437 |
| Nov. 2 | 25,164.36 |
| Nov. 3 | 25,372.01 |
| Nov. 4 | 25,736.51 |
| Nov. 5 | 24,315 |
| Nov. 6 | 24,579.42 |
Daily closing values; the Oct. 6 record is the highest close in the period shown.
Forced Selling, in One Investor’s View
Orlando Gemes, a founding partner and chief investment officer at Fourier Asset Management, read Thursday as a positioning event.
He pointed first to what did not move.
The HYG high-yield bond fund fell 0.2 percent, an investment-grade index rose 0.2 percent, and the 10-year Treasury yield slipped 6 basis points. “The losses travelled through crowded books and leveraged products, not through funding or credit,” he wrote on his verified profile on LinkedIn.
Forced selling, in his telling, did the damage.
Leveraged exchange-traded funds had to sell about $47 billion of stock into the close, the second-largest figure in Nomura’s data back to 2006. Momentum stocks lost 8.2 percent against 1.2 percent for low-volatility shares, and technology long/short hedge funds lost about 4 percent, which put them back to flat for 2026 after a gain of 24 percent through June. Those figures come from Gemes’s post and could not be independently confirmed.
Even inside the Magnificent Seven, the selling was uneven.
Nvidia and Tesla fell about 10 percent, according to Gemes. The hyperscalers, the companies spending the most on data centers, fell 2 to 4 percent.
Three neocloud issuers that sell computing capacity for A.I. work, CoreWeave, IREN and Nebius, make up 6 percent of the convertible bond market but took 36 percent of hedged losses, Gemes said, and 16 of their 17 bonds were issued since 2025. Each company has lost half its market value over the past month, Reuters reported Friday.
Demand Holds, Schroders Says
Webber’s case at Schroders is conditional on demand.
“We still expect the infrastructure to get built, even if some future data centres ultimately need to be relocated to other states or other countries,” Webber said. He added that results across the supply chain, including orders and backlogs for electrical equipment, point the same way.
“This feels like the capitulation phase for the data center capex beneficiary stocks, especially the semiconductors,” Jed Ellerbroek, a portfolio manager at Argent Capital Management, told Reuters.
Buyers did show up Friday, after a jobs report showed employers added 165,000 positions.
The Nasdaq closed up 1.09 percent, at 24,579.42, and the S&P 500 gained 0.31 percent, to 7,376.86. The Dow Jones industrial average slipped 0.46 percent, to 51,285.73. Chip stocks led the rebound: Advanced Micro Devices rose 11 percent, the Philadelphia Semiconductor Index gained 4.2 percent and Nvidia 2.8 percent, according to market data compiled by The Closing Print. For the week, the Nasdaq lost 3.4 percent and the S&P 500 2.7 percent.
The Financing Risk
Schroders ranks financing above politics.
“The bigger risk, in our view, is financing,” Webber wrote. Hyperscalers and frontier model companies “increasingly need both equity and debt markets” to pay for their spending plans. “If financing is not available on attractive terms, investment will have to slow.” Dan Ives, a technology analyst, estimated in a Reuters report in October that 5 percent to 10 percent of planned projects “ultimately will not be built.”
“The bigger risk, in our view, is financing.”
Simon Webber, Head of Global Equities, Schroders
This comes as investors in Anthropic start to question whether the industry bellwether will be able to raise money in line with its expectations on valuations.
Four people familiar with investor discussions told Reuters on Friday that potential investors question whether Anthropic can hold its roadshow in time for a November offering. The roadshow had been expected to start the week of Nov. 9. Investors see the $1.5 trillion valuation discussed recently as the high end of what they expect. Anthropic declined to comment.
Goldman Sachs Asset Management raised the same worry before Thursday’s rout.
Its market note, dated Thursday and built on data through Oct. 30, said higher rates had prompted “scrutiny around the funding requirements for AI capex” and “spread widening across the AI complex,” and that the firm remained “cautious on IG tech.”
Positioning worries Gemes too. Gross leverage is still near 310 percent, he wrote, and the unwinding has further to run. He drew a contrast with 1998:
“In 1998 the crowded trade sat in one fund. Today it is spread across dozens of pods with similar models, stops and funding.”
Orlando Gemes, Fourier Asset Management
Technology capital spending drives technology profits rather than the reverse, said Dhaval Joshi, a global macro strategist. Citing the Kalecki profit equation, he said capex downturns in the mid-80s, 2000 and late 2020 led the profit downturns that followed. “If tech capex slows because, for example, datacentre buildout is being reined in by the newly elected Democrats, then tech profits will inevitably get hit,” Joshi said.
His trade is long a health-care sector fund and short a technology one.
The Dot-Com Yardstick
The dot-com peak came on March 10, 2000, when the Nasdaq composite closed at 5,048.62. It bottomed at 1,114.11 on Oct. 9, 2002, a drop of 77.9 percent, according to Nasdaq data published by the Federal Reserve Bank of St. Louis, and did not close above that high until April 23, 2015. This week’s Nasdaq closed 11.9 percent below its Oct. 6 record of 27,599.89 on Thursday and 10.9 percent below it on Friday.
Nasdaq composite, quarter-end closes plus three marked days, March 2000 to April 2015
View data
| Date | Close |
|---|---|
| Mar. 1, 2000 | 4,784.08 |
| Mar. 10, 2000 | 5,048.62 |
| Mar. 31, 2000 | 4,572.83 |
| June 30, 2000 | 3,966.11 |
| Sept. 29, 2000 | 3,672.82 |
| Dec. 29, 2000 | 2,470.52 |
| Mar. 30, 2001 | 1,840.26 |
| June 29, 2001 | 2,160.54 |
| Sept. 28, 2001 | 1,498.8 |
| Dec. 31, 2001 | 1,950.4 |
| Mar. 28, 2002 | 1,845.35 |
| June 28, 2002 | 1,463.21 |
| Sept. 30, 2002 | 1,172.06 |
| Oct. 9, 2002 | 1,114.11 |
| Dec. 31, 2002 | 1,335.51 |
| Mar. 31, 2003 | 1,357 |
| June 30, 2003 | 1,621.44 |
| Sept. 30, 2003 | 1,802.71 |
| Dec. 31, 2003 | 1,996.62 |
| Mar. 31, 2004 | 2,004 |
| June 30, 2004 | 2,055.65 |
| Sept. 30, 2004 | 1,896.84 |
| Dec. 31, 2004 | 2,175.44 |
| Mar. 31, 2005 | 1,999.23 |
| June 30, 2005 | 2,056.96 |
| Sept. 30, 2005 | 2,151.69 |
| Dec. 30, 2005 | 2,205.32 |
| Mar. 31, 2006 | 2,339.79 |
| June 30, 2006 | 2,172.09 |
| Sept. 29, 2006 | 2,258.43 |
| Dec. 29, 2006 | 2,415.29 |
| Mar. 30, 2007 | 2,421.64 |
| June 29, 2007 | 2,603.23 |
| Sept. 28, 2007 | 2,701.5 |
| Dec. 31, 2007 | 2,652.28 |
| Mar. 31, 2008 | 2,279.1 |
| June 30, 2008 | 2,292.98 |
| Sept. 30, 2008 | 2,091.88 |
| Dec. 31, 2008 | 1,577.03 |
| Mar. 31, 2009 | 1,528.59 |
| June 30, 2009 | 1,835.04 |
| Sept. 30, 2009 | 2,122.42 |
| Dec. 31, 2009 | 2,269.15 |
| Mar. 31, 2010 | 2,397.96 |
| June 30, 2010 | 2,109.24 |
| Sept. 30, 2010 | 2,368.62 |
| Dec. 31, 2010 | 2,652.87 |
| Mar. 31, 2011 | 2,781.07 |
| June 30, 2011 | 2,773.52 |
| Sept. 30, 2011 | 2,415.4 |
| Dec. 30, 2011 | 2,605.15 |
| Mar. 30, 2012 | 3,091.57 |
| June 29, 2012 | 2,935.06 |
| Sept. 28, 2012 | 3,116.23 |
| Dec. 31, 2012 | 3,019.51 |
| Mar. 28, 2013 | 3,267.52 |
| June 28, 2013 | 3,403.25 |
| Sept. 30, 2013 | 3,771.48 |
| Dec. 31, 2013 | 4,176.59 |
| Mar. 31, 2014 | 4,198.99 |
| June 30, 2014 | 4,408.18 |
| Sept. 30, 2014 | 4,493.39 |
| Dec. 31, 2014 | 4,736.05 |
| Mar. 31, 2015 | 4,900.88 |
| Apr. 23, 2015 | 5,056.06 |
| Apr. 30, 2015 | 4,941.42 |
Quarter-end values are the last trading day on or before each quarter end; the first and last rows are the first and last days in the series used (Mar. 1, 2000 and Apr. 30, 2015).
Waiting for Confirmation
The selling before Thursday had already been lopsided.
Technology stocks underperformed the S&P 500 by 10.7 percent over the past month, the most extreme one-month underperformance since May 2002, according to Keith Lerner, chief investment officer at Truist Advisory Services. More than 50 technology stocks in the S&P 1500 fell 10 percent or more, Reuters reported.
“We are now seeing something of a buyers’ strike in tech.”
Keith Lerner, Chief Investment Officer, Truist Advisory Services
Ree put his test in the next week or two.
“What matters is whether Thursday was the washout... or the first leg of one.” Lows after shocks like these “do leave fingerprints, and most of them you can follow on a free charting platform,” Ree said.
Gemes is watching credit.
“Credit has not confirmed the move. It usually lags, then gaps. That is what we are watching.”
Orlando Gemes, Fourier Asset Management
About the data
Index levels in the charts and the dot-com figures use the Nasdaq composite daily close (FRED series NASDAQCOM) from the Federal Reserve Bank of St. Louis, which carries Nasdaq, Inc. data. The 77.9 percent peak-to-trough decline, the April 23, 2015 recovery date, the 10.9 percent and 11.9 percent gaps to the Oct. 6 record and the weekly Nasdaq loss are AVI calculations from that series; the check for an earlier close above the 2000 peak covered every daily close from March 11, 2000 to April 22, 2015. Friday moves for Nvidia, AMD and the Philadelphia Semiconductor Index come from a single source, The Closing Print, and could not be matched to a second. The neocloud bond shares, the leveraged-fund and hedge-fund figures, the 310 percent leverage figure and the Tesla and hyperscaler moves come from Gemes’s post alone, and Ree’s episode counts come from his post alone.
Sources
- Associated Press via NBC Bay Area, Nov. 5: A brutal sell-off for AI stocks sends Wall Street reeling, and the S&P 500 tumbles 4.4%
- Fox Business, Nov. 5: Stocks plunge as Dem midterm sweep fuels AI regulatory concerns
- Reuters via BNN Bloomberg, Nov. 6: Wall Street stocks in relief rally after heavy AI-related selloff
- Reuters via CP24, Nov. 6: AI backlash could threaten Anthropic IPO timing, potential investors say
- Reuters via Investing.com, Oct. 16: CoreWeave bond rout tests market’s math on AI buildout
- Reuters via Kitco, Oct. 22: Investors see risk from US midterms to AI trade as data center backlash builds
- Reuters via The Star, Oct. 31: Midterm US elections, earnings, jobs data loom for AI-wary stock market
- Reuters via Dawn, Jan. 28, 2025: Chinese DeepSeek sparks global AI sell-off, Nvidia loses about $593bn of value
- Schroders, Nov. 6, Simon Webber: “AI volatility: what does the recent sell-off mean for investors?” (PDF supplied by the author)
- BlackRock, Fall 2026 Investment Directions
- Goldman Sachs Asset Management, US Market Pulse, November 2026
- LinkedIn posts by Simon Ree, Orlando Gemes and Dhaval Joshi, quoted verbatim from the file supplied by the author, with titles as shown on their LinkedIn headlines.
- Nasdaq, Inc., via Federal Reserve Bank of St. Louis, series NASDAQCOM (Nasdaq composite daily close).
- TheStreet, Nov. 6: Stock Market Today (Nov. 6, 2026): Nasdaq, S&P 500 rise after midterms AI rout
- The Closing Print, Nov. 6: Post-Market & Weekly Summary
- Yahoo Finance, Nov. 6 live blog: Stock market today: Nasdaq and S&P 500 rebound, Dow slips to cap bruising week for AI stocks
Comments
Sign in with LinkedIn to join the discussion. Your LinkedIn name and photo appear publicly beside your comment. Please keep it civil and on topic.