
News · Policy · US
As Washington faces fresh standoffs, markets prepare to pay the toll
Federal Reserve research shows that past debt-ceiling standoffs raised Treasury yields and pulled money from Treasury money funds before any deadline arrived. With Democrats in control of Congress, the next test starts Dec. 11.
For information only. Not investment advice. Disclaimer
AI-generated summary, reviewed by the editor.
- Fed staff research, not Fed policy, found Treasury yields rose before projected 2011 and 2013 debt-ceiling breach dates, adding roughly $250 million to borrowing costs in each episode.
- Treasury money market funds lost about 7% of assets from Sept. 25 to Oct. 16, 2013, Boston Fed researchers found; these were withdrawals, not principal losses.
- Government funding expires Dec. 11; forecasters expect the Treasury to reach the debt limit in 2027. The 2013 evidence cannot settle how funds would behave today.
It restates the article and adds no new facts. How we use AI
Political gridlock charges markets a price long before a deadline arrives. Federal Reserve research on the debt-ceiling standoffs of 2011 and 2013 found that Treasury yields rose just before the projected breach dates, that the added borrowing costs came to roughly $250 million in each episode, and that investors pulled money out of Treasury money market funds as the 2013 deadline approached.
Democrats won control of Congress on Tuesday, though final seat counts for either chamber were not available early Wednesday. Exit polls showed seven in 10 voters wanted more checks and balances on President Trump. The result leaves neither party able to pass most regular spending bills through the Senate alone, just as Washington approaches two separate deadlines.
The first, Dec. 11, is when government funding expires, and missing it would shut down parts of the government. The second is a federal debt limit that forecasters expect the Treasury to reach in 2027, a risk of a different kind: it threatens the plumbing of the market for Treasury debt, the money market funds that hold short-term Treasuries and the collateralized borrowing that rests on them. Neither outcome is settled. The record does show what the last two debt-ceiling fights cost before they ended.
Two deadlines, two different kinds of risk
Government funding expires Dec. 11, when the stopgap now covering it runs out, 32 days after Congress returns Nov. 9, according to Holland & Knight. The House passed three of the 12 fiscal 2027 spending bills before the election recess, and the Senate finished none. Missing the date would mean the fourth shutdown of Donald Trump’s second term, ABC News reported. The first, which ended Nov. 12, 2025, ran 43 days, the longest on record, Fortune reported.
A shutdown is a spending problem. When appropriations lapse, some government operations stop. A debt-limit standoff is a borrowing problem. It concerns the Treasury’s legal authority to borrow, and the worst case is late payment of obligations the government already owes. That worst case reaches into the market’s plumbing: the $27.8 trillion of federal debt in the hands of private and foreign creditors, according to Roll Call; the money market funds that hold short-term Treasuries; and the collateralized borrowing that Treasuries underpin. The Boston Fed identified that collateral role as one reason a failure to pay on time could disrupt markets beyond the securities directly affected. The Federal Reserve evidence in this article comes from debt-ceiling episodes in 2011 and 2013. It does not measure the market cost of a shutdown.
Two timelines, read left to right. Not to scale.
- Nov. 9Congress returns
- Dec. 11Funding expires
- Shutdown riskSome agency operations halt
The Federal Reserve evidence in this article covers the debt-limit lane only.
- $40.1TDebt against a $41.1T ceiling
- Limit reachedCrandall: around Feb. or March. Punchbowl: as soon as early to mid-2027
- Extraordinary measuresTreasury buys time
- X-dateLate 2027 or early 2028 (Crandall)
The debt limit is a separate clock. Federal debt stood at $40.1 trillion against a statutory ceiling of $41.1 trillion, which Congress raised by $5 trillion in the 2025 reconciliation law, leaving about $1 trillion of room.
Federal debt by holder against the $41.1 trillion statutory ceiling, trillions of dollars
View the data
| Holder | Trillions of dollars |
|---|---|
| Private and foreign creditors | $27.8 |
| Trust funds | $7.7 |
| Federal Reserve | $4.6 |
| Total | $40.1 |
| Statutory ceiling | $41.1 |
When the debt reaches that ceiling is uncertain. Lou Crandall, chief economist at Wrightson ICAP, projects the debt could reach the limit around February or March, Roll Call reported, with the so-called X-date, the point at which Treasury runs out of cash and accounting maneuvers to pay every bill, falling in late 2027 or early 2028. Reaching the limit does not mean a missed payment: Treasury can typically buy at least a few extra months with emergency cash and extraordinary measures such as suspending certain trust fund investments. Outside projections cited by Punchbowl News put the limit as soon as early to mid-2027, and federal revenue has been coming in below expectations since the Congressional Budget Office’s February estimates, a shortfall that, all else equal, shortens the runway. “You do have a debt ceiling some time next year,” Tai Hui, chief market strategist for Asia-Pacific at J.P. Morgan Asset Management, said, according to Reuters.
Until Tuesday, Republicans had a way to clear the limit without a single Democratic vote. Some had floated raising it in the lame-duck session through budget reconciliation, the procedure that lets the Senate pass tax and spending bills by simple majority. A Democratic flip in either chamber “effectively removes reconciliation as a tool lawmakers can use next year for a debt-limit bill that wouldn’t require 60 Senate votes,” Roll Call reported. Republicans keep their 53 Senate seats until January, which leaves the lame duck as the remaining window, but Senate Majority Leader John Thune can lose only three votes on a Republican-only measure, Punchbowl reported, and not every Republican is eager. “Debt limit’s a next year thing,” Sen. Thom Tillis, Republican of North Carolina, told the outlet in October.
Regular spending bills face a second hurdle. Most need 60 votes to clear the Senate’s filibuster, and ABC reported that Democrats are almost certain to fall short of that number even with control of the chamber. Control does give them “a much bigger say on administration and judicial nominations,” Alexander Bolton wrote in The Hill. It does not give them 60 votes, and Republicans, with 53 seats until January, are well short of it. That leaves neither side able to pass a funding bill alone.
How markets pay the toll early
Federal Reserve Board economists David Cashin, Erin Syron Ferris, Beth Klee and Cailey Stevens measured the cost of past debt-ceiling standoffs in a March 2017 staff paper, “Take it to the Limit: The Debt Ceiling and Treasury Yields.” They found that yields on all Treasuries were 4 to 8 basis points higher than they otherwise would have been just before the projected breach dates in 2011 and 2013. The toll was far steeper on bills maturing near those dates, where excess yields peaked at 46 basis points in 2013 and 21 in 2011. Treasury’s borrowing costs were “roughly $250 million higher than they otherwise would have been” in each episode. The paper is staff research, not a statement of Fed policy.
Basis points above what would otherwise have been expected, just before the projected breach dates
View the data
| Measure | Low, basis points | High, basis points |
|---|---|---|
| All Treasuries, 2011 and 2013 | 4 | 8 |
| Bills near the 2011 breach date | 21 | 21 |
| Bills near the 2013 breach date | 46 | 46 |
Set against today’s $40.1 trillion of debt, $250 million is small, less than one-thousandth of 1% by an Asian Value Investor calculation, and yields “fell precipitously upon resolution,” the authors wrote. That comparison sets a 2011 and 2013 cost against today’s debt stock; the paper does not scale its estimate to current levels. The authors used overnight index swap rates to control for market-wide rate moves unrelated to the standoffs. That matters because a Treasury rally measured on its own says little about what a standoff cost: yields can fall in absolute terms and still sit above where they would have been.
The larger damage turned up in places investors treat as cash. A Federal Reserve Bank of Boston brief by Ali Ozdagli and Joe Peek, published in November 2013, found that assets in Treasury money market funds fell about 7% from Sept. 25 to Oct. 16, 2013, against about 2% at prime funds. Those are changes in fund assets driven by withdrawals; nobody lost 7% of their principal.
Change in fund assets, Sept. 25 to Oct. 16, 2013, percent. These are withdrawals, not losses of principal.
View the data
| Fund type | Change in assets |
|---|---|
| Treasury money market funds | −7% |
| Prime money market funds | −2% |
The strain spread to short-term corporate borrowing and the bill market. In the week ending Oct. 11, issuance of commercial paper maturing in under a week doubled, and paper maturing in 41 to 80 days rose sixfold. Prime funds cut their Treasury holdings and added repurchase agreements. A hump formed in the Treasury bill curve around the Oct. 24 maturity date and flattened right after Congress acted. “Although a technical default was avoided, such crises do have costs, including the disruption of financial markets,” the authors wrote.
The 2011 episode told a messier story. Stocks sold off and Treasuries rallied at once. The Budget Control Act ended the standoff on Aug. 2, and Standard & Poor’s cut the U.S. credit rating from AAA to AA+ on Aug. 5. Between July 22 and Aug. 19, the S&P 500 fell about 16.5% by an Asian Value Investor calculation, while the 10-year Treasury yield fell from 2.99% to 2.07%, according to the Federal Reserve’s series on FRED. Other economic and financial developments were also at work that month, and the whole decline cannot be assigned to the debt ceiling.
Money market fund rules have changed since 2013. The Securities and Exchange Commission announced rules in July 2014 requiring institutional prime funds to use a floating share price. In July 2023 it announced amendments that remove the provisions allowing funds to suspend redemptions, require institutional prime and institutional tax-exempt funds to impose liquidity fees when daily net redemptions exceed 5% of net assets unless liquidity costs are de minimis, and raise minimum liquidity requirements. Whether funds and dealers would behave as they did in 2013 depends on today’s fund rules and holdings, which the 2013 evidence cannot settle.
If the 2013 pattern repeated, which no one can promise, the first signs of a tightening deadline would sit in the plumbing before they reached stocks: bills maturing near the suspected date cheapening against neighbors a week on either side, outflows from Treasury-only money funds, commercial paper issuers shortening or lengthening maturities, wider repo and credit spreads.
Short-term fear, long-term history
Markets did not wait for the results to settle. Stocks closed higher Tuesday, with the S&P 500 up 0.4% and the Nasdaq Composite up 0.8%, then slid as Democratic wins came in. At 11:57 p.m. Eastern, Fox Business reported that S&P 500 futures were down 1.3%, Nasdaq-100 futures were down 2.2%, and the 10-year Treasury yield had fallen 6 basis points to 4.906%. By 6 a.m. in Central Europe the 10-year was back near 4.945%, Euronews said, and Japan’s Nikkei was down 2.85%.
Strategists quoted by Euronews, Reuters and Fox Business read the move as a bet on gridlock. One warned of what gridlock brings, and two said the selloff could fade. “Democratic control of Congress would increase the potential for legislative gridlock, fiscal brinkmanship, debt-ceiling disputes, and congressional investigations,” said Chris Weston of Pepperstone. Charu Chanana, chief investment strategist at Saxo in Singapore, said markets appeared to be pricing in a stronger Democratic showing that “could reduce expectations for further fiscal stimulus,” and that “lower Treasury yields could eventually provide some relief, so the initial selloff may not necessarily be sustained.” Michael Arone, chief investment strategist at State Street Global Advisors, argued the larger danger was the reaction itself. “I don’t think the big risk to markets is from the blue wave; it’s investors overreacting to a blue wave,” he said.
The long record gives that second view some support. Ned Davis Research found that the S&P 500 rose through year-end in five of eight midterm cycles since 1930 in which the president’s party lost the House, according to Fox Business.
A narrower calculation by Asian Value Investor covers the seven midterms since the Nasdaq-100 began in which the president’s opponents gained at least one chamber: 1986, 1994, 2006, 2010, 2014, 2018 and 2022. The index, which represents the largest non-financial companies listed on the Nasdaq stock exchange, was higher twelve months later in every one of them, by an average of about 22.5%. The S&P 500 was higher after twelve months in all seven.
Twelve months after seven midterms since 1986 in which opponents of the president gained a chamber
The same seven windows also contain losses. In every one, the Nasdaq-100 fell more than 10% from a running peak at some point before the twelve months were up. After the 1986 midterm the index finished the twelve months up 1.6% after dropping 39.9% along the way. The S&P 500 fell more than 10% from a peak inside the window in five of the seven.
To be sure, seven observations cannot separate politics from interest rates, earnings or recessions, and the calculation makes no such claim. A twelve-month return also says little about the weeks before a deadline, which is where the Federal Reserve’s evidence is concentrated.
Leverage, a veto and the lame duck
Both parties can claim a mandate, and the exit polls support only part of each claim. Half of voters said they saw the election as a chance to rebuke President Trump, Reuters reported, and in SSRS exit polls for a consortium led by The Associated Press, three-quarters said they were “angry” or “dissatisfied” with the way the country is headed. Nothing in those figures measures appetite for a shutdown or a debt-limit fight. “There is now a generational remake of the Senate map that is going to change America. Americans voted for change, and now Democrats must deliver,” Chuck Schumer, the Senate Democratic leader, said.
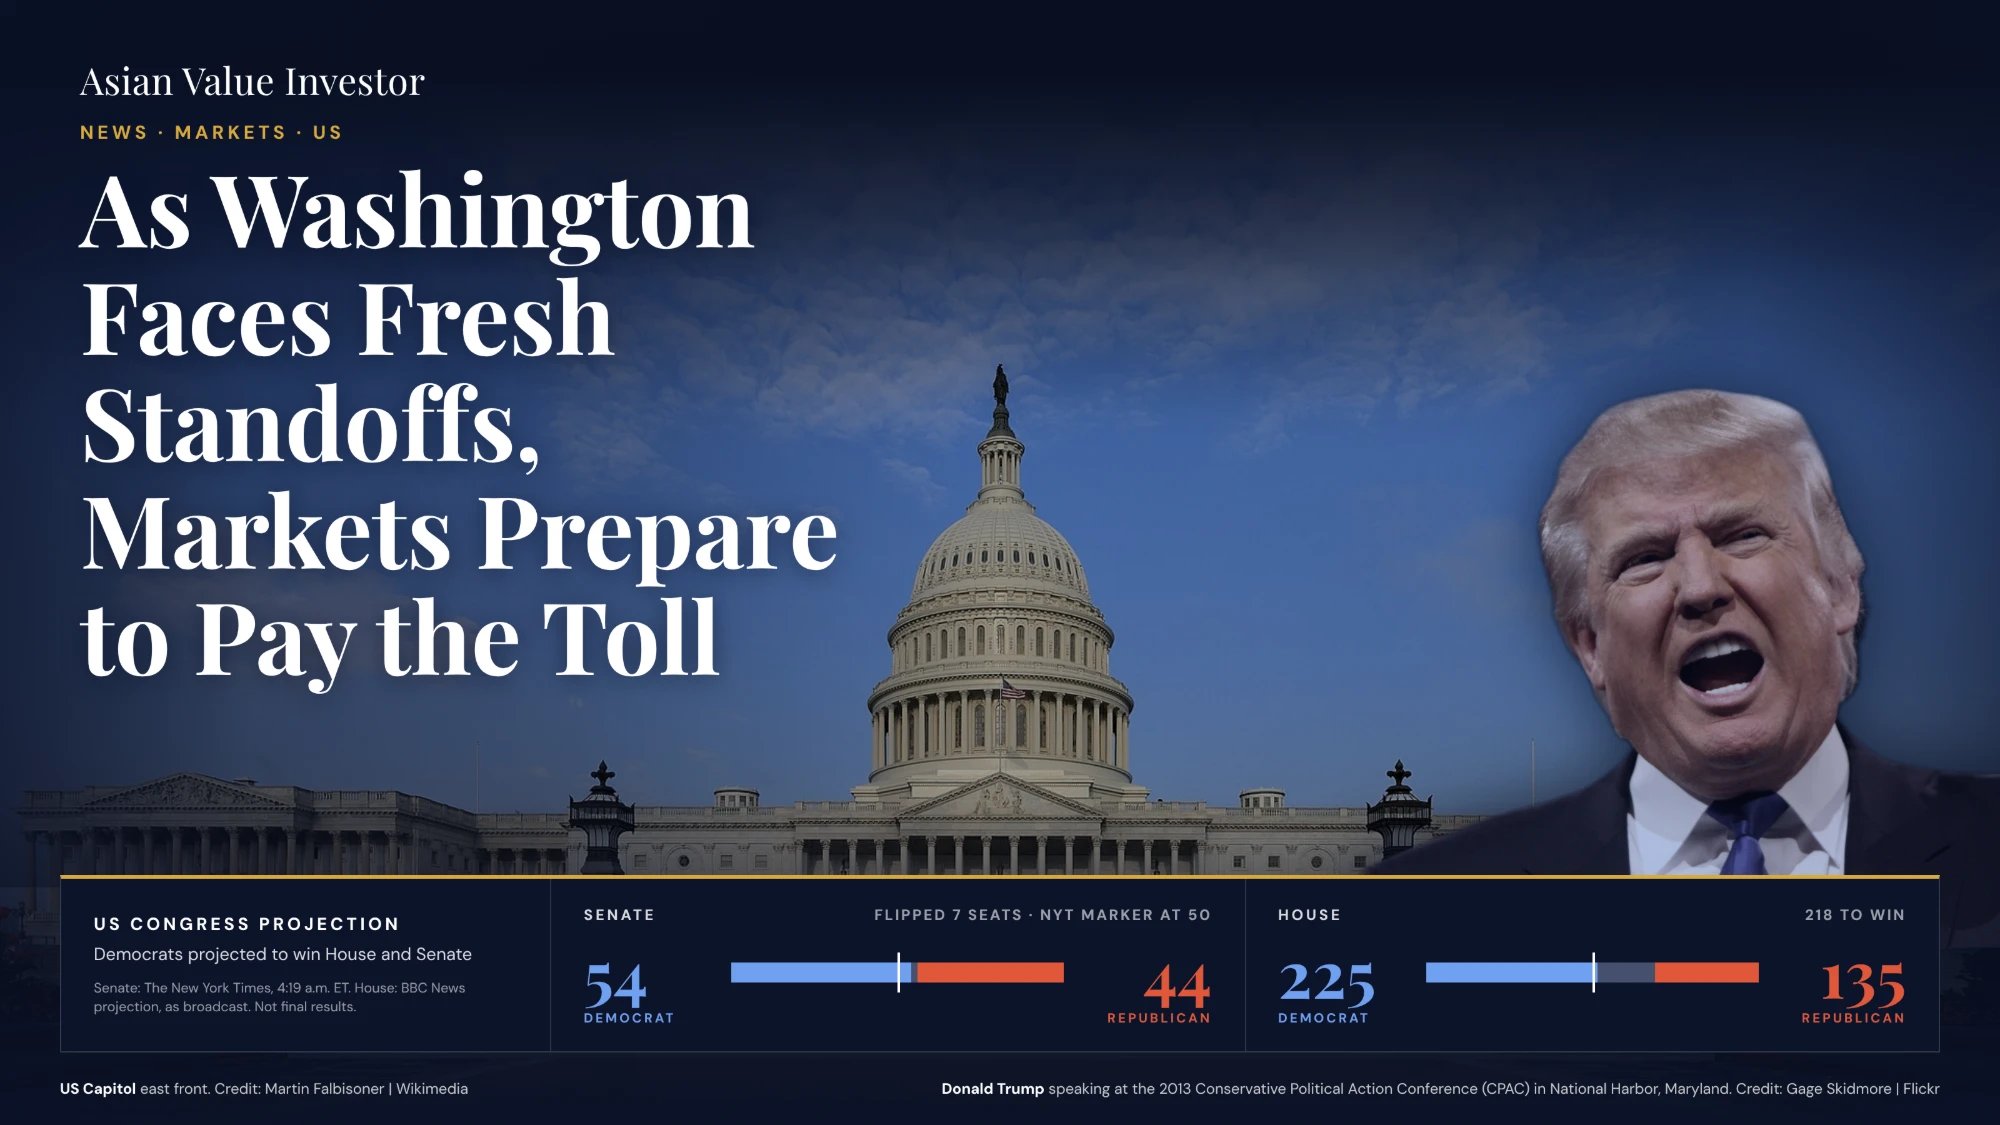
Republican incumbents fell in Ohio, where Sherrod Brown beat Sen. Jon Husted, and in Kansas, where Adam Hamilton beat Sen. Roger Marshall. Susan Collins’s 30-year Senate career ended in Maine. Races in Mississippi, Michigan and Alaska were still uncalled early Wednesday, and Al Jazeera counted at least 51 Democratic Senate seats. As of 4:19 a.m. Eastern on Wednesday, The New York Times projected Democrats at 54 Senate seats to Republicans’ 44, a gain of seven. The BBC projected 225 House seats for Democrats to 135 for Republicans, with 218 needed, as broadcast. Both are projections, not final results. In the House, Democrats won all 20 of the especially competitive contests decided by then, and an unprecedented Republican effort to redraw districts largely failed.
Trump has said the result was not about him. “I wasn’t on the Ballot and if I was, we would have won IN A LANDSLIDE!” he posted on social media. “Thank you for your attention to this matter.” He also congratulated Democrats in a Fox News interview and said he would work with them on issues such as immigration, though he threatened to veto any “insane” bills they passed, Reuters reported.
Before the polls closed he had been more specific about how he expects the next two years to go. “I have the ultimate power — it’s called ‘veto,’” he told CBS News’s Robert Costa.
“Historically, you veto for a couple of months and then they come and say, ‘We’ve got to make a deal,’” Trump said.
He was talking about legislation in general, not funding bills in particular. Funding and borrowing bills are the ones Congress cannot leave undone for long.
Reuters reported that Democrats are expected to investigate Trump’s administration, family and allies once seated in January, and to demand concessions on major legislation. House Democrats are preparing a first-100-hours package that includes bills to remove tariffs, end the Iran war and cut health insurance costs, ABC reported, citing multiple reports. They lack the votes to make any of it law over a veto.
Trump has also pointed to executive power that does not depend on Congress. He told CBS that the Supreme Court’s Trump v. Slaughter ruling “gives the president tremendous powers that it never had before,” and CBS reported that he sees it as allowing sweeping control over federal agencies regardless of who holds the House and Senate. Those are Trump’s words and CBS’s account of his view, not a description of what the ruling holds. Any use of that power could move part of the dispute into implementation and litigation.
Democrats have their own leadership questions. Schumer is expected to be elected majority leader in early December, Bolton wrote, though some senators-elect, including Juliana Stratton of Illinois, have threatened not to support him. Whether he can deliver his caucus’s votes for a bargain is untested. Republicans keep their 53 Senate seats until January, and Thune must decide whether to spend the lame duck confirming as many Trump nominees as possible or weeks on a reconciliation package to fund the Defense Department over Democratic objections, Bolton wrote. A debt-limit increase would have to fit somewhere in that.
Compromise has not been ruled out, and some of the evidence points toward it. House Democratic leader Hakeem Jeffries has said he favors finishing the spending bills in the lame-duck period, Holland & Knight reported, and the firm called a second stopgap into early next year “a realistic outcome.” The sticking points are specific. Sen. Amy Klobuchar, Democrat of Minnesota, said in September that Democrats were pursuing a two-year delay in a Supplemental Nutrition Assistance Program cost shift rather than the one-year delay under consideration, and the firm judged Democrats unlikely to concede on it. Newsweek pointed to the precedent: “The lame duck after Trump’s last midterm defeat ended in a 35-day shutdown that ran well into the new Democratic majority’s term.”
No date is settled. Crandall’s estimate is one analyst’s, Punchbowl’s range comes from outside projections, and the real figure will move with every tax receipt. What exists is Dec. 11, and a Senate where neither party can reach 60 votes alone. A deal remains possible, though the positions taken so far point toward conflict.
Sen. Cynthia Lummis, Republican of Wyoming, told Punchbowl in October that she had to hold her nose to vote for the last increase.
“I would find it really hard to vote for another debt ceiling increase,” she said. “Doesn’t mean I wouldn’t do it.”
Comments
Sign in with LinkedIn to join the discussion. Your LinkedIn name and photo appear publicly beside your comment. Please keep it civil and on topic.