
News · Policy · Japan
Bank of Japan Normalizing Policy to Achieve Price Stability: Ueda
Underlying inflation has reached 2 percent for the first time in many decades, the governor said, but holding it there will take years of policy adjustment.
For information only. Not investment advice. Disclaimer
AI-generated summary, reviewed by the editor.
- Governor Kazuo Ueda said the Bank of Japan is normalizing policy to achieve price stability, with underlying inflation at 2 percent for the first time in many decades.
- Japan's current account surplus, built on exports in the 1980s, is now sustained by investment income, and Mr. Ueda tied it to corporate saving.
- Mr. Ueda said he sees signs that Japanese companies are turning inward and called it an open question whether the shift will last.
It restates the article and adds no new facts. How we use AI
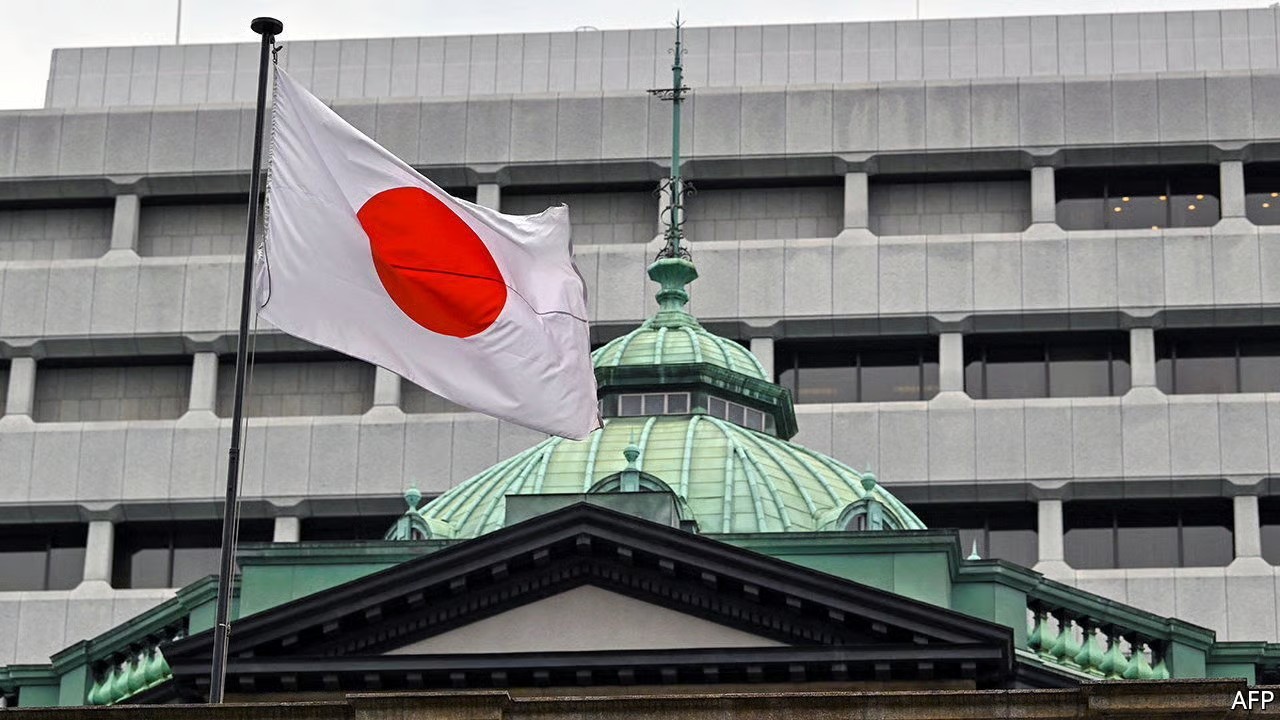
The Bank of Japan is normalizing monetary policy to achieve price stability, Governor Kazuo Ueda said Friday, with underlying inflation at 2 percent for the first time in many decades.
Mr. Ueda was speaking at the International Monetary Fund, where he had just delivered the Michel Camdessus Central Banking Lecture and then taken questions from its managing director, Kristalina Georgieva. A week earlier, his bank had held its benchmark rate at around 1.25 percent on an 8-to-1 vote, following increases in June and September. Ms. Georgieva called the process of normalization “impressively smooth” so far. The yen was quoted at about 157.5 to the dollar on Oct. 30, according to Federal Reserve data.
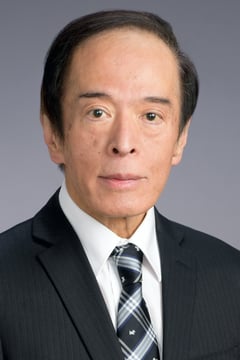
The work is not done, he said. Underlying inflation is the bank’s gauge of the trend in prices. Wages are growing 2.5 to 3 percent, a pace he called consistent with 2 percent inflation, but he said he does not know whether the economy can stay there for a very long time. Higher energy prices, which Ms. Georgieva tied to a war in the Middle East, are beginning to reach consumers, Mr. Ueda said, and consumer price inflation, now around 3 percent, is expected to rise further into early next year. He did not rule out a return to the unconventional tools the bank once used on a massive scale if shocks prove severe enough.
The bank began moving away from those tools on March 19, 2024, when, under Mr. Ueda, it ended its negative interest rate policy and its yield curve control, which had held down long-term government bond yields. The decision closed a 17-year stretch without a rate increase, during which Japan struggled with deflation or very low inflation. The country escaped that trap partly because of the global inflation surge of 2021 to 2023.
The conversation followed a lecture on a different subject: why Japan’s current account surplus, the broadest measure of its transactions with the rest of the world, has persisted for four decades. The two threads met in Mr. Ueda’s answer to a question about capital flows. Once price stability is achieved, he said, nominal variables, the economists’ term for prices and other quantities measured in money, will be “less of an impediment” to the efficient allocation of resources, including capital flows. He did not address the yen carry trade, in which investors borrow cheaply in yen to buy higher-yielding assets abroad, or the financial stability risks Ms. Georgieva had raised.
A Carry Trade Question
Ms. Georgieva introduced her question on normalization as an easy one. Japan’s policy rate is now 1.25 percent, she said, and normalization has been impressively smooth so far, even as global policy rates rise and expectations about exchange rates and appetite for risk shift. She wanted to know how it would affect the current account and capital flows, including the yen carry trade, “a subject of great attention in recent months,” and whether there were financial stability risks to watch.
Mr. Ueda took her at her word and kept the answer simple. The Bank of Japan is normalizing policy to achieve price stability, he said, and once that is achieved, nominal variables will be “less of an impediment” to the efficient allocation of resources, including capital flows. Neither the carry trade nor financial stability came up in his reply. He ended instead with a question of his own: “How about that?”
Targeting Inflation
The Bank of Japan declared at its last policy meeting that underlying inflation had reached 2 percent “for the first time in many decades,” Mr. Ueda said. Ms. Georgieva asked whether he was satisfied with where Japan stands against its 2 percent target, and what the mood had been around the table. Inside and outside the bank, he said, it was “a significant milestone,” with a lot left to do: Inflation has to be kept there for years through appropriate adjustments to policy.
The mood was yes and no, he said. Businesses and households have adapted only in part. Prices are rising at a trend of around 2 percent, and wages are growing 2.5 to 3 percent, a pace consistent with 2 percent inflation. “So I think we are in that equilibrium.” Whether it can last a long time, “we still don’t know.” People still complain about inflation at around those levels, and 2 percent “hasn’t quite become a social norm yet.”
Higher interest rates, by contrast, have drawn few complaints. “Somewhat surprisingly,” the bank has not heard significant ones, he said, partly because real interest rates have not risen as much.
Ms. Georgieva asked how he weighs the risks with no end in sight to the energy price pressures.
Mr. Ueda said that if peace returns to the region in the “not too distant future,” the bank expects inflation to fall back to 2 percent in late 2027 or 2028, with underlying inflation staying near 2 percent. “There are some upside risks to it,” he said.
Ms. Georgieva noted that the Federal Reserve’s new chairman, Kevin Warsh, has cautioned against saying too much. The Bank of Japan discusses the question constantly, Mr. Ueda said, but has no formal committee for it. Communication can close the information gap between a central bank and the public, though it can also create moral hazard in markets. The bank’s framework rests on underlying inflation. “Now, as I said, underlying inflation is two percent,” he said. “Our goal is to keep it there.”
Old Tools, New Risks
Ms. Georgieva, calling him a pioneer of unconventional policy, asked how Japan now sees quantitative easing, negative interest rates and yield curve control. It has been so long since the Bank of Japan used them on a massive scale that it “feels like ages,” Mr. Ueda said, and he has forgotten some of the details of how they worked. He remembered what he had told a conference in the United States almost 30 years ago, though, that a zero interest rate is “a lot more painful than you central bankers might think.” He added: “And I think that was right.” The tools had some positive effects, he said, “but they have not been, as many would say, perfect substitutes for rate cuts in positive territory.”
Asked whether conditions could call for them again, he said: “Depending on the severity of the shocks, we may be obliged to deploy these tools again.” If so, the bank should look for ways to limit side effects, including the effect on the functioning of the market.
Artificial intelligence, which Ms. Georgieva said dominated the IMF and World Bank annual meetings in Bangkok, drew a narrower answer. Mr. Ueda declined to discuss market swings. “Let me stay away from talking about what’s been happening in the AI space,” he said, referring to the last few days or couple of weeks. In general, he said, AI has been a positive demand shock for Japan’s economy, raising exports, output and, to some extent, prices. The supply side is murkier. He cited U.S. data showing that among AI adopters, output has grown steadily while employment has declined since 2022 or 2023. “So clearly there’s evidence of productivity rising.” Japan could do well, he said, given its labor shortages, or badly, given the rigidity of its labor market and institutions, because deploying AI efficiently requires flexible reshuffling of workers.
For financial stability, he said, he worries about cyber risks, “as does everyone else.” Japan has seen sharp increases in cyber attacks over the last month or two. “It’s scary,” he said. Small firms, small banks and smaller shared service providers have not done enough to protect themselves, and attacks on them have had larger effects on the economy than people expected. The bank has been identifying vulnerable areas and applying patches, he said, and has to support those efforts.
A Surplus That Outlasted Its Causes
The lecture is named for Michel Camdessus, who led the Fund as managing director from January 1987 to February 2000, the longest tenure to date, according to the IMF. It was the 13th, Ms. Georgieva said in introducing it, and she called “large and rising global imbalances” a matter of concern. History suggests, she said, that widening imbalances have often preceded financial crises or abrupt reversals in capital flows. She placed the lecture amid a war in the Middle East that is keeping energy prices high and an artificial intelligence investment boom that she said is lifting growth in some countries while adding to inflation pressure and worries about financial stability.
Mr. Ueda opened by crediting Mr. Camdessus as “among the most articulate voices calling for surplus nations to act as locomotives for global demand” in the mid-1980s. Japan embraced that call, he said, “yet history took an unexpected turn.”
What followed was a current account surplus that has held at roughly 2 to 4 percent of economic output for four decades, even as the forces behind it changed, Mr. Ueda said. Exports built it in the 1980s, and income from overseas investments sustains it now. His lecture laid out how a surplus that began as a trade phenomenon came to have little to do with trade in goods.
Standard economic theory holds that an aging society spends down its savings and drifts into external deficit. Japan’s households followed the script, Mr. Ueda said. Its nonfinancial companies, which turned from net borrowers into chronic net savers in the late 1990s, did not.
Japan’s net foreign assets, what it owns abroad minus what foreigners own in Japan, reached a record 561.75 trillion yen at the end of 2025, the Finance Ministry reported in May. It was the seventh straight annual record, and it still placed Japan third among the world’s creditor nations, behind Germany and China. Mr. Ueda’s lecture argued that Japanese companies’ decision to invest their savings abroad rather than at home helped build that stockpile.
Mr. Ueda said he sees signs that Japanese companies are turning inward, and called it an open question whether the shift will last.
From Exports to Investment Income
Until the early 1980s, Japan’s current account swung between deficits and surpluses, sometimes within a few years. Then it settled into surplus and stayed there.
The total barely moved, but what it was made of changed completely. Japan’s surplus in goods trade peaked above 4 percent of gross domestic product in the mid-1980s and has since turned into a deficit. Over the same stretch, the primary income surplus, which is chiefly what Japan earns on its investments abroad, grew from negligible to more than 6 percent of GDP.
Balance of payments components, % of GDP
View data
| Year | Goods trade | Primary income | Current account |
|---|---|---|---|
| 1985 | 3.98 | 0.49 | 3.68 |
| 1986 | 4.44 | 0.46 | 4.19 |
| 1987 | 3.74 | 0.67 | 3.44 |
| 1988 | 3.11 | 0.70 | 2.66 |
| 1989 | 2.70 | 0.77 | 2.13 |
| 1990 | 2.27 | 0.74 | 1.46 |
| 1991 | 2.76 | 0.75 | 1.96 |
| 1992 | 3.28 | 0.94 | 2.96 |
| 1993 | 3.21 | 0.93 | 3.03 |
| 1994 | 3.02 | 0.85 | 2.73 |
| 1995 | 2.50 | 0.84 | 2.10 |
| 1996 | 1.65 | 1.13 | 1.37 |
| 1997 | 2.24 | 1.24 | 2.09 |
| 1998 | 2.96 | 1.22 | 2.76 |
| 1999 | 2.65 | 1.21 | 2.43 |
| 2000 | 2.34 | 1.41 | 2.59 |
| 2001 | 1.64 | 1.52 | 1.94 |
| 2002 | 2.28 | 1.47 | 2.57 |
| 2003 | 2.35 | 1.63 | 3.04 |
| 2004 | 2.70 | 1.94 | 3.69 |
| 2005 | 2.19 | 2.21 | 3.49 |
| 2006 | 2.05 | 2.63 | 3.76 |
| 2007 | 2.61 | 3.03 | 4.58 |
| 2008 | 1.09 | 2.69 | 2.79 |
| 2009 | 1.08 | 2.53 | 2.73 |
| 2010 | 1.87 | 2.67 | 3.80 |
| 2011 | −0.07 | 2.92 | 2.08 |
| 2012 | −0.84 | 2.77 | 0.94 |
| 2013 | −1.70 | 3.44 | 0.86 |
| 2014 | −1.98 | 3.68 | 0.74 |
| 2015 | −0.16 | 3.89 | 3.01 |
| 2016 | 1.00 | 3.44 | 3.85 |
| 2017 | 0.87 | 3.66 | 4.03 |
| 2018 | 0.20 | 3.76 | 3.43 |
| 2019 | 0.03 | 3.77 | 3.37 |
| 2020 | 0.50 | 3.51 | 2.89 |
| 2021 | 0.31 | 4.59 | 3.74 |
| 2022 | −2.65 | 5.99 | 1.96 |
| 2023 | −1.07 | 5.94 | 3.62 |
| 2024 | −0.42 | 6.36 | 4.52 |
Percent of GDP. Services and secondary income are not shown, so the first two columns do not add to the third.
Japan is not the first rich country to travel this road, Mr. Ueda noted. Britain’s trade balance fell into deficit as its economy matured, while income from its overseas holdings kept the current account positive. Around the turn of the 20th century, Britain’s net foreign investment income approached 8 percent of national income. Japan, he said, “has evolved from a workshop of the world into a financier to the world.”
Economists have a name for the pattern, the balance of payments stages hypothesis, in which a country moves from borrower to mature creditor. Mr. Ueda said Japan’s version needs a closer look at the accounting, because the way the savings got there contradicts the textbook.
Companies Kept the Surplus Alive
A current account surplus is the arithmetic residue of a country saving more than it invests at home. Mr. Ueda called the way Japan produced that excess a “profound macroeconomic paradox.”
Households behaved as the textbooks say they should. Net household saving was a major counterpart to the surplus until the mid-1990s, then fell substantially over three decades as the population aged. The government ran persistent and widening deficits. A 1997 Federal Reserve Bank of San Francisco Economic Letter by Kenneth Kasa, which Mr. Ueda cited, surveyed the literature of the day and concluded that “a broad spectrum of alternative simulation methodologies all point to a declining Japanese trade balance. The only debate concerns the timing.” Mr. Ueda, who taught macroeconomics at the time, said in remarks that went beyond the written text that he repeated that prediction in his own classroom. He did not name the economists who made it.
In a footnote to the written text, Mr. Ueda said that, to be fair, Japan’s trade account has been in deficit for most of the time since the early 2010s. The current account has not.
Companies are why. After an investment boom around 1990, corporate investment rates kept falling for two decades while corporate saving trended upward. By the late 1990s, nonfinancial firms had gone from net borrowers to “chronic, massive net savers,” Mr. Ueda said, and they have stayed that way. In the latest year on his charts, the gap between what those companies saved and what they invested was roughly 3.6 percent of GDP, down from a peak of about 7.3 percent in 2010, based on Cabinet Office data.
Nonfinancial corporations, % of GDP
View data
| Year | Gross saving | Total investment | Saving minus investment |
|---|---|---|---|
| 1980 | 11.82 | 16.22 | −4.40 |
| 1981 | 11.46 | 16.18 | −4.72 |
| 1982 | 11.43 | 15.63 | −4.20 |
| 1983 | 11.43 | 14.43 | −3.00 |
| 1984 | 11.87 | 15.23 | −3.36 |
| 1985 | 12.45 | 16.23 | −3.78 |
| 1986 | 13.32 | 16.06 | −2.74 |
| 1987 | 13.44 | 15.60 | −2.16 |
| 1988 | 13.20 | 17.13 | −3.93 |
| 1989 | 12.22 | 18.74 | −6.52 |
| 1990 | 10.86 | 19.57 | −8.71 |
| 1991 | 10.60 | 19.63 | −9.03 |
| 1992 | 10.80 | 17.67 | −6.87 |
| 1993 | 11.43 | 15.84 | −4.41 |
| 1994 | 14.75 | 17.26 | −2.51 |
| 1995 | 15.88 | 17.92 | −2.04 |
| 1996 | 17.61 | 18.65 | −1.04 |
| 1997 | 16.96 | 19.00 | −2.04 |
| 1998 | 16.70 | 17.95 | −1.25 |
| 1999 | 17.08 | 16.22 | 0.86 |
| 2000 | 19.08 | 17.45 | 1.63 |
| 2001 | 19.28 | 17.13 | 2.15 |
| 2002 | 20.20 | 15.66 | 4.54 |
| 2003 | 20.61 | 15.82 | 4.79 |
| 2004 | 21.35 | 16.17 | 5.18 |
| 2005 | 20.33 | 16.86 | 3.47 |
| 2006 | 19.67 | 17.34 | 2.33 |
| 2007 | 19.99 | 17.69 | 2.30 |
| 2008 | 20.25 | 17.95 | 2.30 |
| 2009 | 19.99 | 14.76 | 5.23 |
| 2010 | 22.25 | 14.92 | 7.33 |
| 2011 | 21.32 | 15.64 | 5.68 |
| 2012 | 21.51 | 16.12 | 5.39 |
| 2013 | 22.18 | 15.92 | 6.26 |
| 2014 | 21.81 | 16.86 | 4.95 |
| 2015 | 23.27 | 17.54 | 5.73 |
| 2016 | 23.59 | 17.26 | 6.33 |
| 2017 | 23.70 | 17.64 | 6.06 |
| 2018 | 22.58 | 18.36 | 4.22 |
| 2019 | 22.14 | 18.19 | 3.95 |
| 2020 | 21.30 | 17.48 | 3.82 |
| 2021 | 22.45 | 18.02 | 4.43 |
| 2022 | 21.62 | 19.14 | 2.48 |
| 2023 | 22.60 | 18.81 | 3.79 |
| 2024 | 22.38 | 18.82 | 3.56 |
Percent of GDP. The last column is an AVI calculation from the plotted values. The vertical axis starts at 8.
The Hangover
Mr. Ueda started in the mid-1980s, when Japan was the world’s second-largest economy and its surplus, driven overwhelmingly by merchandise trade, drew intense scrutiny. The Plaza Accord engineered a sharp fall in the U.S. dollar. In the 1986 Maekawa Report, Japan committed to expand domestic demand and shorten working hours. Aggressive easing cushioned the economy against a rapidly rising yen.
“In hindsight, these expansionary measures contributed directly to the late-1980s investment boom and the dramatic run-up in equity and real estate prices,” he said.
The surplus did narrow around 1990, as companies poured money into factories and equipment at home. Then the bubble burst and it rebounded. “The narrowing of the surplus proved temporary,” Mr. Ueda said, “but the structural scars left on corporate behavior proved long-lasting.”
The scars were arithmetic. Companies held assets that had lost much of their value against debts that had not. Repaying those debts became a priority from the late 1990s through the early 2010s, and a banking crisis in the late 1990s tightened the squeeze. Return on capital in Japan fell sharply in the 1990s and never regained its pre-bubble heights, he said, while returns in the United States stayed relatively stable.
Corporate profits over net fixed assets, nonfinancial corporations, %
View data
| Year | Japan, 2020 benchmark | Japan, 2000 benchmark | United States |
|---|---|---|---|
| 1980 | – | – | 6.57 |
| 1981 | – | 16.49 | 6.99 |
| 1982 | – | 16.39 | 5.64 |
| 1983 | – | 15.77 | 6.45 |
| 1984 | – | 17.06 | 8.01 |
| 1985 | – | 17.63 | 7.63 |
| 1986 | – | 17.75 | 6.16 |
| 1987 | – | 18.03 | 6.67 |
| 1988 | – | 18.91 | 7.20 |
| 1989 | – | 18.64 | 6.33 |
| 1990 | – | 17.33 | 5.74 |
| 1991 | – | 15.87 | 5.56 |
| 1992 | – | 13.29 | 5.80 |
| 1993 | – | 11.99 | 6.67 |
| 1994 | – | 10.73 | 8.06 |
| 1995 | 7.17 | 11.12 | 8.47 |
| 1996 | 7.97 | 11.56 | 9.06 |
| 1997 | 6.92 | 11.31 | 9.42 |
| 1998 | 5.74 | 9.27 | 8.37 |
| 1999 | 5.44 | 9.43 | 7.79 |
| 2000 | 6.47 | 9.78 | 6.48 |
| 2001 | 6.25 | 8.88 | 4.82 |
| 2002 | 6.44 | 9.37 | 5.70 |
| 2003 | 6.59 | 9.33 | 6.86 |
| 2004 | 7.16 | 10.37 | 8.55 |
| 2005 | 6.75 | 10.56 | 9.33 |
| 2006 | 6.29 | 9.59 | 9.92 |
| 2007 | 6.34 | 10.43 | 8.33 |
| 2008 | 5.46 | 8.72 | 7.02 |
| 2009 | 3.50 | 6.27 | 5.64 |
| 2010 | 5.47 | – | 7.87 |
| 2011 | 4.96 | – | 8.25 |
| 2012 | 5.54 | – | 8.74 |
| 2013 | 6.07 | – | 8.91 |
| 2014 | 5.97 | – | 9.05 |
| 2015 | 7.10 | – | 8.60 |
| 2016 | 7.32 | – | 8.07 |
| 2017 | 7.57 | – | 7.90 |
| 2018 | 6.88 | – | 8.30 |
| 2019 | 6.13 | – | 8.06 |
| 2020 | 4.20 | – | 8.24 |
| 2021 | 4.91 | – | 11.37 |
| 2022 | 4.06 | – | 11.23 |
| 2023 | 5.46 | – | 11.14 |
| 2024 | 4.87 | – | 11.00 |
| 2025 | – | – | 10.75 |
Percent. A dash means the series does not cover that year. The two Japan series use different benchmark years and are not directly comparable.
Repair ended in stages. Financial pressure eased in the mid-2000s once the banking crisis was resolved, though the global financial crisis interrupted the recovery. A firmer turning point came around 2011 and 2012, when domestic investment and borrowing began to edge up.
Corporate saving stayed high anyway, and much of it went abroad. Direct investment, in which a company buys or builds a business overseas, made up 21.0 percent of Japan’s capital outflows from 1996 to 2011 and 46.5 percent from 2012 to 2025, according to figures in his lecture. Portfolio investment in stocks and bonds fell from 53.9 percent to 26.2 percent over the same periods.
Share of capital outflows by type, %, calendar years
View data
| Type of investment | 1996–2011 | 2012–2025 |
|---|---|---|
| Portfolio | 53.9% | 26.2% |
| Direct | 21.0% | 46.5% |
| Other | 25.1% | 27.4% |
Percent of capital outflows, calendar years. Shares are as printed in the lecture and may not sum to 100 because of rounding.
The returns justified it, Mr. Ueda said. Returns on direct investment abroad held above 8 percent for much of the post-adjustment period even as yields on debt and equity investments declined. Much of what overseas affiliates earned stayed abroad and was reinvested there, which the statistics record as fresh direct investment. It still swelled Japan’s primary income surplus, and it still counts as Japanese corporate saving, whether or not the money ever comes home.
Annual rate of return on Japan’s foreign assets, %
View data
| Year | Direct investment | Equity and fund shares | Debt securities |
|---|---|---|---|
| 1997 | 5.50 | 3.75 | – |
| 1998 | 2.69 | 3.66 | – |
| 1999 | 2.82 | 3.19 | – |
| 2000 | 8.93 | 2.74 | – |
| 2001 | 5.66 | 2.93 | 4.48 |
| 2002 | 4.17 | 3.57 | 3.58 |
| 2003 | 5.26 | 4.75 | 3.62 |
| 2004 | 8.48 | 5.07 | 3.48 |
| 2005 | 10.01 | 5.49 | 3.48 |
| 2006 | 10.34 | 5.63 | 3.64 |
| 2007 | 9.58 | 5.56 | 3.92 |
| 2008 | 4.44 | 5.06 | 3.58 |
| 2009 | 6.13 | 6.49 | 3.36 |
| 2010 | 7.40 | 5.77 | 2.81 |
| 2011 | 7.58 | 7.91 | 2.65 |
| 2012 | 6.63 | 8.93 | 2.49 |
| 2013 | 9.41 | 8.86 | 2.45 |
| 2014 | 8.91 | 4.55 | 2.64 |
| 2015 | 8.23 | 4.55 | 2.66 |
| 2016 | 7.93 | 3.43 | 2.59 |
| 2017 | 8.50 | 3.10 | 2.64 |
| 2018 | 8.23 | 2.75 | 2.75 |
| 2019 | 8.20 | 2.71 | 2.95 |
| 2020 | 6.30 | 2.15 | 2.68 |
| 2021 | 9.94 | 2.37 | 2.41 |
| 2022 | 11.77 | 2.78 | 2.55 |
| 2023 | 10.27 | 2.65 | 3.55 |
| 2024 | 9.84 | 2.45 | 3.83 |
| 2025 | 9.06 | 2.14 | 3.97 |
Percent. Debt securities start in 2001.
A Rival Theory and the Labor-Market Test
A 2024 Bank of Japan survey of firms gave Mr. Ueda what he called a firsthand window into why domestic investment stayed subdued for so long. Asked to look back over the period since the mid-1990s, managers most often pointed to structurally declining growth expectations. Debt repayment and solvency dominated decisions in the 1990s and 2000s. In the 2010s, many firms prioritized precautionary cash buffers, while some, especially large ones, went after overseas acquisitions and direct investment.
Weak growth expectations, forged during the years of balance sheet repair, hardened into habit, he said. Demographics then reinforced them.
Academic models offer a rival explanation built on population alone. In neoclassical trade and growth theory, a shrinking working-age population makes capital abundant relative to labor, which depresses the return on capital at home. Companies and households respond by sending money abroad and moving production offshore, which widens the external surplus.
Mr. Ueda called the theory elegant, then tested it against the record. It requires Japan’s labor market to have been intensely tight in the 1990s and 2000s. It was not. The Bank of Japan’s output gap, a measure of unused capacity in the economy, stayed almost continuously negative from 1993 to 2012. Unemployment averaged about 4.2 percent across those two decades, by a calculation from the lecture’s chart, high by Japan’s own standards and well above the 2.5 percent average of the 1980s. Total employment kept growing over the long run as more women and older people entered the workforce.
Unemployment rate, %
View data
| Year | Unemployment rate |
|---|---|
| 1980 | 2.0 |
| 1981 | 2.2 |
| 1982 | 2.4 |
| 1983 | 2.6 |
| 1984 | 2.7 |
| 1985 | 2.6 |
| 1986 | 2.8 |
| 1987 | 2.8 |
| 1988 | 2.5 |
| 1989 | 2.3 |
| 1990 | 2.1 |
| 1991 | 2.1 |
| 1992 | 2.2 |
| 1993 | 2.5 |
| 1994 | 2.9 |
| 1995 | 3.2 |
| 1996 | 3.4 |
| 1997 | 3.4 |
| 1998 | 4.1 |
| 1999 | 4.7 |
| 2000 | 4.7 |
| 2001 | 5.0 |
| 2002 | 5.4 |
| 2003 | 5.3 |
| 2004 | 4.7 |
| 2005 | 4.4 |
| 2006 | 4.1 |
| 2007 | 3.9 |
| 2008 | 4.0 |
| 2009 | 5.1 |
| 2010 | 5.1 |
| 2011 | 4.6 |
| 2012 | 4.3 |
| 2013 | 4.0 |
| 2014 | 3.6 |
| 2015 | 3.4 |
| 2016 | 3.1 |
| 2017 | 2.8 |
| 2018 | 2.4 |
| 2019 | 2.4 |
| 2020 | 2.8 |
| 2021 | 2.8 |
| 2022 | 2.6 |
| 2023 | 2.6 |
| 2024 | 2.5 |
| 2025 | 2.5 |
Percent, rounded to 0.1. The 1980s and 1993–2012 averages are AVI calculations from the plotted values.
Demographics mattered anyway, he said, through expectations. Companies anticipated a shrinking domestic market long before they ran short of workers, which lowered the return they expected at home and pulled foreign investment forward. “It is only in recent years,” he said, “that acute labor scarcity has become a reality.”
Signs of Change at Home
Recently, though, the Bank of Japan has seen tangible signs of structural change. In its latest survey, more than 70 percent of Japanese firms said they invested more actively at home in 2023 and 2024 than in earlier years. The most common reason was the urgent need to address domestic labor shortages. Large firms also pointed to decarbonization, digital transformation and bringing supply chains back to Japan.
Labor scarcity pushes some capital abroad, Mr. Ueda said, but it also forces companies to deepen domestic capital and automate. Business fixed investment has passed its early-1990s peak, and bank lending is growing at more than 5 percent, the fastest pace in three decades apart from 2020, when government support for small-business loans was in place. With moderate inflation back, he said, corporate appetite for risk appears to be reawakening.
Gross fixed capital formation, domestic, trillion yen
View data
| Year | Trillion yen |
|---|---|
| 1980 | 48.1 |
| 1981 | 51.8 |
| 1982 | 53.1 |
| 1983 | 51.8 |
| 1984 | 56.9 |
| 1985 | 64.2 |
| 1986 | 66.7 |
| 1987 | 69.3 |
| 1988 | 79.1 |
| 1989 | 93.0 |
| 1990 | 105.7 |
| 1991 | 112.4 |
| 1992 | 105.9 |
| 1993 | 96.1 |
| 1994 | 90.5 |
| 1995 | 93.7 |
| 1996 | 99.7 |
| 1997 | 102.5 |
| 1998 | 95.9 |
| 1999 | 90.3 |
| 2000 | 95.2 |
| 2001 | 92.2 |
| 2002 | 85.1 |
| 2003 | 84.1 |
| 2004 | 85.0 |
| 2005 | 90.1 |
| 2006 | 93.6 |
| 2007 | 94.5 |
| 2008 | 92.8 |
| 2009 | 78.8 |
| 2010 | 76.1 |
| 2011 | 77.5 |
| 2012 | 80.5 |
| 2013 | 82.6 |
| 2014 | 89.4 |
| 2015 | 95.3 |
| 2016 | 95.2 |
| 2017 | 98.4 |
| 2018 | 102.2 |
| 2019 | 103.1 |
| 2020 | 98.2 |
| 2021 | 101.9 |
| 2022 | 109.1 |
| 2023 | 116.0 |
| 2024 | 120.1 |
Trillion yen. The vertical axis starts at 40.
The latest balance-of-payments data show a surplus that is still growing. Preliminary Finance Ministry figures for the first half of 2026, reported by Xinhua, put the current account surplus at 17.43 trillion yen, up 22.5 percent from a year earlier. Goods trade swung to a surplus of 742.1 billion yen from a deficit of 1.46 trillion yen. Primary income, the part Mr. Ueda called the pillar, rose 0.3 percent to 20.49 trillion yen. June alone showed a deficit of 92.3 billion yen, the first in 17 months.
An Open Question
Whether Japan is finally getting the adjustment led by domestic demand that policymakers sought four decades ago “remains an open question,” Mr. Ueda said. Further aging may accelerate household dissaving, while higher domestic productivity and capital spending could shrink the corporate saving surplus. Either would narrow the gap between what Japan saves and what it invests.
But Japan “sits atop a colossal stock of net foreign assets,” he said, and the gap in returns favoring foreign over domestic investment remains wide.
“Net primary income will remain an enduring pillar of Japan’s external accounts for years to come.”
Kazuo Ueda, Governor, Bank of Japan
Mr. Ueda attached a caveat to his own account. The history, he said, “does not establish how the current account would have evolved under a different policy response.” What it shows is that external adjustment “must be understood alongside changes in investment incentives, corporate balance sheets, and demographics.”
He ended with two sentences. “Japan’s surplus has been remarkably persistent. The reasons for it have been rather less so.”
Geopolitics May Not Bring the Money Home
When the lecture ended, Ms. Georgieva moderated an exchange built from questions she said came from taking the pulse across the Fund. She began with one she said was on many minds: whether shifts in the geopolitical environment could push Japanese companies to invest more at home, and how quickly.
“I’m afraid I have a very unclear answer to this question,” Mr. Ueda said.
The general answer is yes, he said, and domestic business investment will probably rise for this reason. By how much is very uncertain. Many global companies have spent some time adjusting their supply chains for resilience at the expense of efficiency, he said, but a supply chain owned by a Japanese company does not necessarily end up in Japan. The investment could simply move from one Asian country to another. Ms. Georgieva said she would not put names on them.
The government is one source of a push, Mr. Ueda said. Measures to stimulate domestic investment in strategic areas are going into the 2027 budget now under discussion in the Diet, and they “will have some positive impact on domestic investment.”
She turned next to demographics, asking how much they had shaped Japan’s current account and what other aging societies should take from it. Mr. Ueda called it very difficult. Aging lowered growth expectations, which kept investment stagnant through the 1990s and 2000s and into the 2010s, and that was one of the major reasons the surplus expanded and stayed large over three decades. Household saving did decline, as life-cycle theory predicts. “But that didn’t become a major force in shaping the current account surplus,” he said. “Rather, it was corporate savings.”
His advice to countries that expect to age was to be careful about which channels of influence apply to them, since it varies from country to country. Ms. Georgieva noted that many of those countries look to immigration to raise labor force participation, while Japan has been more cautious.
Learn the Theories, Then Use Judgment
Ms. Georgieva asked what he would tell young people drawn to monetary policy. Mr. Ueda remarked that she made it sound as if he were “in the twilight of my career.” Then he answered. It is good to learn many theories of the economy, markets and the financial system, he said. “But none of the theories fit all circumstances.” When no model fits, refine one yourself. When that fails: “Then exercise good judgment. That’s all I can say.”
Sources
- Bank of Japan, speech page (lecture dated Nov. 6, 2026)
- Transcript of the lecture and the conversation with Ms. Georgieva
- Bank of Japan, Statement on Monetary Policy, Oct. 30, 2026, with the Sept. 18 and June 16 decisions
- IMF, 2026 Michel Camdessus Central Banking Lecture event page and Camdessus biography
- Jiji Press via Nippon.com, net external assets at end-2025, May 26, 2026
- Xinhua, first-half 2026 current account, Aug. 10, 2026
- Federal Reserve data via FRED, yen per dollar
Comments
Sign in with LinkedIn to join the discussion. Your LinkedIn name and photo appear publicly beside your comment. Please keep it civil and on topic.