
News · Macro · US
Why a Burst A.I. Bubble Could Feel Worse Than the Dot-Com Bust
The Federal Reserve has less room to cut interest rates than it did in 2001 even as a burst A.I. boom could leave unemployment elevated for years, Nobel Prize-winning economist Paul Krugman says.
For information only. Not investment advice. Disclaimer
AI-generated summary, reviewed by the editor.
- Paul Krugman says a burst A.I. boom would likely bring a recession at least as bad as the dot-com bust; the article calls his six-recession sample thin.
- Information-processing equipment and software investment hit 5.35 percent of U.S. output in the third quarter, above the 4.46 percent late-2000 peak, in an author calculation.
- Krugman argues the Fed and Congress have less room than in 2001; Morningstar's economists say an A.I. spending slowdown is unlikely to cause a recession.
It restates the article and adds no new facts. How we use AI
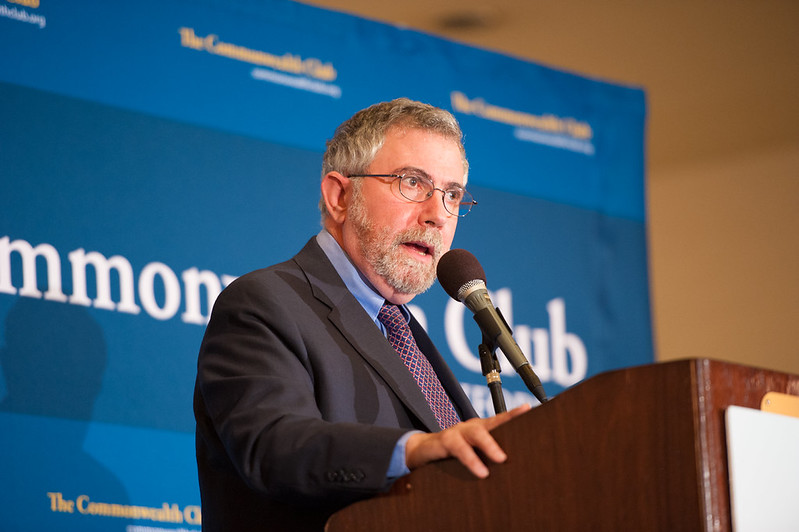
A burst A.I. boom would likely bring a recession at least as bad as the dot-com bust, with a recovery that will keep unemployment elevated for years, Nobel Prize winning economist Paul Krugman said.
According to the National Bureau of Economic Research, the share of Americans aged 25 to 54 with jobs did not bottom until September 2003, 22 months after the dot-com recession ended in November 2001.
This comes as investment in information-processing equipment and software reached 5.35 percent of U.S. economic output in the third quarter, above the 4.46 percent peak in late 2000 (Figure 1).
Nonfinancial corporate stocks were worth 255 percent of gross domestic product at the end of the second quarter, against 163 percent in early 2000 (Figure 2). Jared Bernstein and Ryan Cummings, two economists, cite 240 percent against 160, apparently from a different series. A repricing on that scale would reach household wealth and, because the builders have started to borrow, lenders as well.
View data
| Quarter | Share of GDP, % |
|---|---|
| Q1 1995 | 3.24 |
| Q4 2000 | 4.46 |
| Q1 2005 | 3.41 |
| Q1 2010 | 3.56 |
| Q1 2015 | 3.70 |
| Q1 2020 | 3.91 |
| Q1 2025 | 4.38 |
| Q3 2026 | 5.35 |
View data
| Quarter | Nonfinancial, % of GDP | All public, % of GDP |
|---|---|---|
| Q1 1995 | 69 | 82 |
| Q1 2000 | 163 | 172 |
| Q3 2002 | 79 | 88 |
| Q4 2007 | 115 | 122 |
| Q1 2010 | 96 | 104 |
| Q1 2015 | 141 | 149 |
| Q1 2020 | 129 | 141 |
| Q1 2025 | 197 | 224 |
| Q2 2026 | 255 | 287 |
The Nasdaq Composite fell 5.5 percent on Nov. 5, leaving it in correction territory, more than 10 percent below last month’s record high. Three days later, in a Nov. 8 post on his paywalled Substack, Krugman wrote that “the vibes have definitely shifted,” while saying he does not know whether it is a real turning point. He did not argue that A.I. is a bubble. He asked what history says if the boom ends badly.
A milder view has support. Bernstein and Cummings, writing in The New York Times on Nov. 6, see a consensus building among investors, academics and analysts that any bust would be mild, like 2001, and argue that it is too optimistic. Morningstar’s economists take the milder view, saying in the summary of a Nov. 5 report that an A.I. spending slowdown is unlikely to cause a recession and that the Fed could offset a demand shock. The Federal Reserve, which raised interest rates in September, next meets Dec. 9.
Why Recoveries Differ
Krugman sorts the six recessions he counts since 1969 into two groups by how quickly jobs returned. The first three, in his account, followed Federal Reserve tightening against inflation. When the Fed let up, pent-up demand returned and hiring recovered fast. The later three followed overreach by companies and lenders: commercial real estate and the savings and loans around 1990, the technology bubble in 2001, and housing and shadow banks in 2007. Cutting rates does less after those, he argues, because high rates were not what caused the slump.
View data
| Month | Employed, % of ages 25 to 54 |
|---|---|
| 1965-01 | 67.3 |
| 1970-11 | 69.2 |
| 1975-03 | 69.0 |
| 1982-11 | 72.8 |
| 1991-03 | 78.7 |
| 2000-04 | 81.9 |
| 2001-11 | 79.7 |
| 2003-09 | 78.6 |
| 2009-06 | 75.9 |
| 2012-09 | 76.0 |
| 2020-04 | 69.6 |
| 2026-10 | 80.7 |
Three years after the 1975 recession ended, the share of 25-to-54-year-olds with jobs was 6.2 percent higher, and the one that ended in 1982 left it 5.9 percent higher (Figure 4). By the same measure, 1991 produced a gain of 0.3 percent and 2001 a loss of 0.8 percent, with the ratio bottoming at 78.6 percent, down from 79.7 percent when the 2001 recession ended. It took until September 2012 for prime-age employment to regain its June 2009 level.
View data
| Recession ended | After 12 months, % | After 24 months, % | After 36 months, % |
|---|---|---|---|
| 1970 | +0.0 | +0.4 | +2.6 |
| 1975 | +2.0 | +3.5 | +6.2 |
| 1982 | +2.6 | +4.5 | +5.9 |
| 1991 | -0.6 | -0.6 | +0.3 |
| 2001 | -1.1 | -1.3 | -0.8 |
| 2009 | -0.9 | -1.2 | -0.4 |
Housing starts fell from an annual rate of 2.2 million in April 1978 to 837,000 in November 1981, a drop of 62 percent from that monthly peak, and topped the 1978 peak again by February 1984 (Figure 5). Krugman describes the fall as roughly half.
View data
| Month | Starts, thousands, annual rate |
|---|---|
| 1976-01 | 1,367 |
| 1978-04 | 2,197 |
| 1980-04 | 1,051 |
| 1981-11 | 837 |
| 1984-02 | 2,260 |
| 1986-12 | 1,833 |
Six recessions are a thin sample, so the pattern is only suggestive. The employment series and the recessions are Krugman’s own, so this check replicates his evidence. The explanation, that rate cuts work less well when private-sector overreach caused the slump, is his argument.
How a Burst Would Reach the Economy
A burst could start in three places: stock prices, spending on data centers and equipment, or borrowers’ ability to pay or refinance.
The first is stocks. Lower prices cut into household wealth and confidence. Krugman notes that investors could instead rotate into other stocks, which would limit the losses, but he adds that after 2000 stock market value as a share of GDP fell by half and nothing offset it.
The second is spending. Lost orders reach construction, equipment makers and their suppliers. Amazon, Microsoft, Alphabet and Meta have guided to roughly $720 billion to $740 billion of capital spending this year, according to a tally by the technology analyst Charles Fitzgerald. The total overstates A.I. spending, though. A Federal Reserve staff note says hyperscaler capital spending includes non-A.I. outlays, and that only about a third of Amazon’s property and equipment is servers and networking.
Imports change the math. Equipment bought abroad adds to investment but subtracts through imports, so a drop in those purchases would not take the full price off U.S. GDP. The same note says gross A.I.-related investment overstates the buildout’s contribution when import content is ignored, and that in quarters when imports jumped, the net-export drag offset much of the gross investment. Krugman makes the same point about Korea and Taiwan, which would absorb part of the blow. That narrows the exposure through equipment, though construction, software, stock losses and credit losses remain.
The third is credit. A year ago the builders were mostly spending their own cash, Bernstein and Cummings write. Since then they have borrowed, issuing $445 billion of A.I.-related debt in the first eight months of 2026, or 1.4 percent of GDP. Counting off-balance-sheet deals, the pair estimate A.I. infrastructure debt at roughly 7 percent of GDP, and they say that approaches levels of subprime mortgage lending that helped trigger the financial crisis, though households and banks are less exposed now. Definitions of debt, leases and purchase commitments vary. According to Advisor Perspectives, a chart by Gordon Johnson of GLJ Research shows a basket of five-year credit default swaps on the five largest hyperscalers rising from 115 to 162 basis points over several months, though the article argues that most of the rise reflects Oracle.
Krugman does not divide a bust this way, but his argument fits it. Stocks alone would not make a recession. Investment and credit falling together would be the strongest basis for a long, slow recovery.
Bernstein and Cummings ran the Federal Reserve’s macroeconomic model on a dot-com-style selloff. They report a 1.4 percent fall in real GDP, against 0.4 percent in 2001, with unemployment rising from 4.2 percent, the September rate, to above 7 percent. October’s rate was 4.1 percent. The result measures depth; the history above measures how long jobs take to return. The op-ed leaves out the model’s inputs. Krugman cites the result and calls it roughly three times the 2001 hit, which makes it part of his case and a poor check on it.
Why the Damage Could Be Smaller
The Fed’s Oct. 28 statement describes activity as expanding at a strong pace and capital investment as “robust.” The share of 25-to-54-year-olds with jobs was 80.7 percent in October, near its April 2000 high of 81.9 percent. A Fed staff note found no sign yet of broad worker displacement from A.I., though it does not address recession risk.
The Fed and Congress Have Less Room
Krugman argues that monetary policy (interest rates) and fiscal policy (taxing and spending) are both more constrained than in 2001.
The federal funds rate was about 6.5 percent in mid-2000, and the Fed brought it to roughly 1 percent by the end of 2003 (Figure 6). The effective rate averaged 3.88 percent in October. The Fed raised its target range by a quarter point in September on a 12 to 0 vote, its first increase since 2023, and held it at 3¾ to 4 percent on Oct. 28, with Lisa Cook and Beth Hammack, two of the 12 voters, dissenting in favor of another increase. The statement says inflation remains elevated. A cut of the 2001 size is not available, and a central bank still debating whether to raise rates would have to reverse course before it could cushion a bust.
View data
| Month | Effective rate, % |
|---|---|
| 2000-06 | 6.53 |
| 2003-12 | 0.98 |
| 2007-06 | 5.25 |
| 2009-01 | 0.15 |
| 2015-01 | 0.11 |
| 2019-07 | 2.40 |
| 2021-01 | 0.09 |
| 2023-08 | 5.33 |
| 2026-09 | 3.75 |
| 2026-10 | 3.88 |
Krugman says rates cannot go below zero. After 2008, though, the Fed also bought bonds to push borrowing costs down once its policy rate reached zero, so “less room” applies to conventional rate cuts and leaves other tools in play.
Fiscal room is narrower than in 2001, when Bernstein and Cummings say the government ran a surplus of 1.2 percent of GDP. The Congressional Budget Office estimates the fiscal 2026 deficit at $2.0 trillion, $218 billion more than in 2025, in a year without a recession. That works out to about 6 percent of GDP, using the Bureau of Economic Analysis’s output estimates. Total federal debt, which also counts what the government owes its own trust funds, was 121 percent of GDP in the second quarter. Krugman doubts that a stimulus deal is possible in the next two years and says markets could resist heavy new borrowing even afterward. Those are his predictions about politics and bond markets.
The Open Question Is Credit
The biggest unknown is how far losses on that debt would spread. If lenders take heavy losses, the downturn could be deeper than 2001’s and the recovery slower, with a Fed that has less room and a Congress that has less to spend. Krugman wrote that he has no firm view yet on how serious the risks are at companies such as CoreWeave and Oracle, and that he will return to them.
Sources
- Paul Krugman, “After the Bubble Bursts,” Substack, Nov. 8, 2026
- Jared Bernstein and Ryan Cummings, “Tech Stocks Had a Terrible Day. What’s Coming Could Be Worse,” The New York Times, Nov. 6, 2026
- Morningstar, “Could an AI Spending Crunch Cause a Recession?” Nov. 5, 2026
- ABC7 Chicago, “Dow closes down 1,800 points, Nasdaq into correction territory, wiping out gains from midterm results rally”
- Charles Fitzgerald, Platformonomics, “Follow the CAPEX: Q3 2026 Scoreboard,” Oct. 30, 2026
- Federal Reserve Board staff, “The AI Buildout and the Economy: Publicly Available Data to Assess AI’s Impact,” FEDS Notes, July 17, 2026
- Advisor Perspectives, “Is There Really Carnage in Hyperscaler Credit?” Aug. 3, 2026
- Federal Reserve, FOMC statement, Oct. 28, 2026
- Federal Reserve, FOMC statement, Sept. 16, 2026
- Congressional Budget Office, Monthly Budget Review: September 2026, Oct. 8, 2026
- Federal Reserve Bank of St. Louis, FRED
- Admiral Markets, “FOMC October 2026: Fed Holds Rates in a 10-2 Vote as Markets Price a December Hike”
Comments
Sign in with LinkedIn to join the discussion. Your LinkedIn name and photo appear publicly beside your comment. Please keep it civil and on topic.