
News · Credit · Global
The Wall That Private Credit Built
In the first quarter of this year, the average withdrawal request across the 12 largest funds was 12.1% of total invested money. They are only allowed to release 5%. Seven of the twelve hit that limit, spread the withdrawals proportionally across everyone who asked, and ended up paying out just 53 cents on every dollar requested.
When Blackstone, Ares, and Blue Owl raised hundreds of billions in private credit funds over the past decade, they sold investors a story: higher yields, lower volatility, and none of the mark-to-market chaos that comes with public markets. It worked. Assets in the sector grew past $1.7 trillion globally.
Now comes the bill.
Private credit and business development companies entered 2026 carrying a liability structure that would have looked risky five years ago and looks more uncomfortable by the quarter. The problem is the liability structure, not the loan book.
Across the 12 largest non-traded Business Development Companies or BDCs (collectively representing more than 80% of non-traded AUM in the category), Q1 2026 redemption requests averaged 12.1% of shares outstanding. The standard quarterly gate cap is 5%. Seven of the 12 activated those gates and processed requests pro rata. In total, managers honored about 53% of what investors asked to take out.
Seven funds hit their gate in the same quarter. The queue doesn't resolve itself.
The Revolver Problem
Bank revolvers and warehouse lines are the oxygen supply of private credit. When they're available and cheap, platforms can lend aggressively, manage cash flows, and meet redemptions without selling assets at inconvenient prices. When they're not, the options narrow quickly.
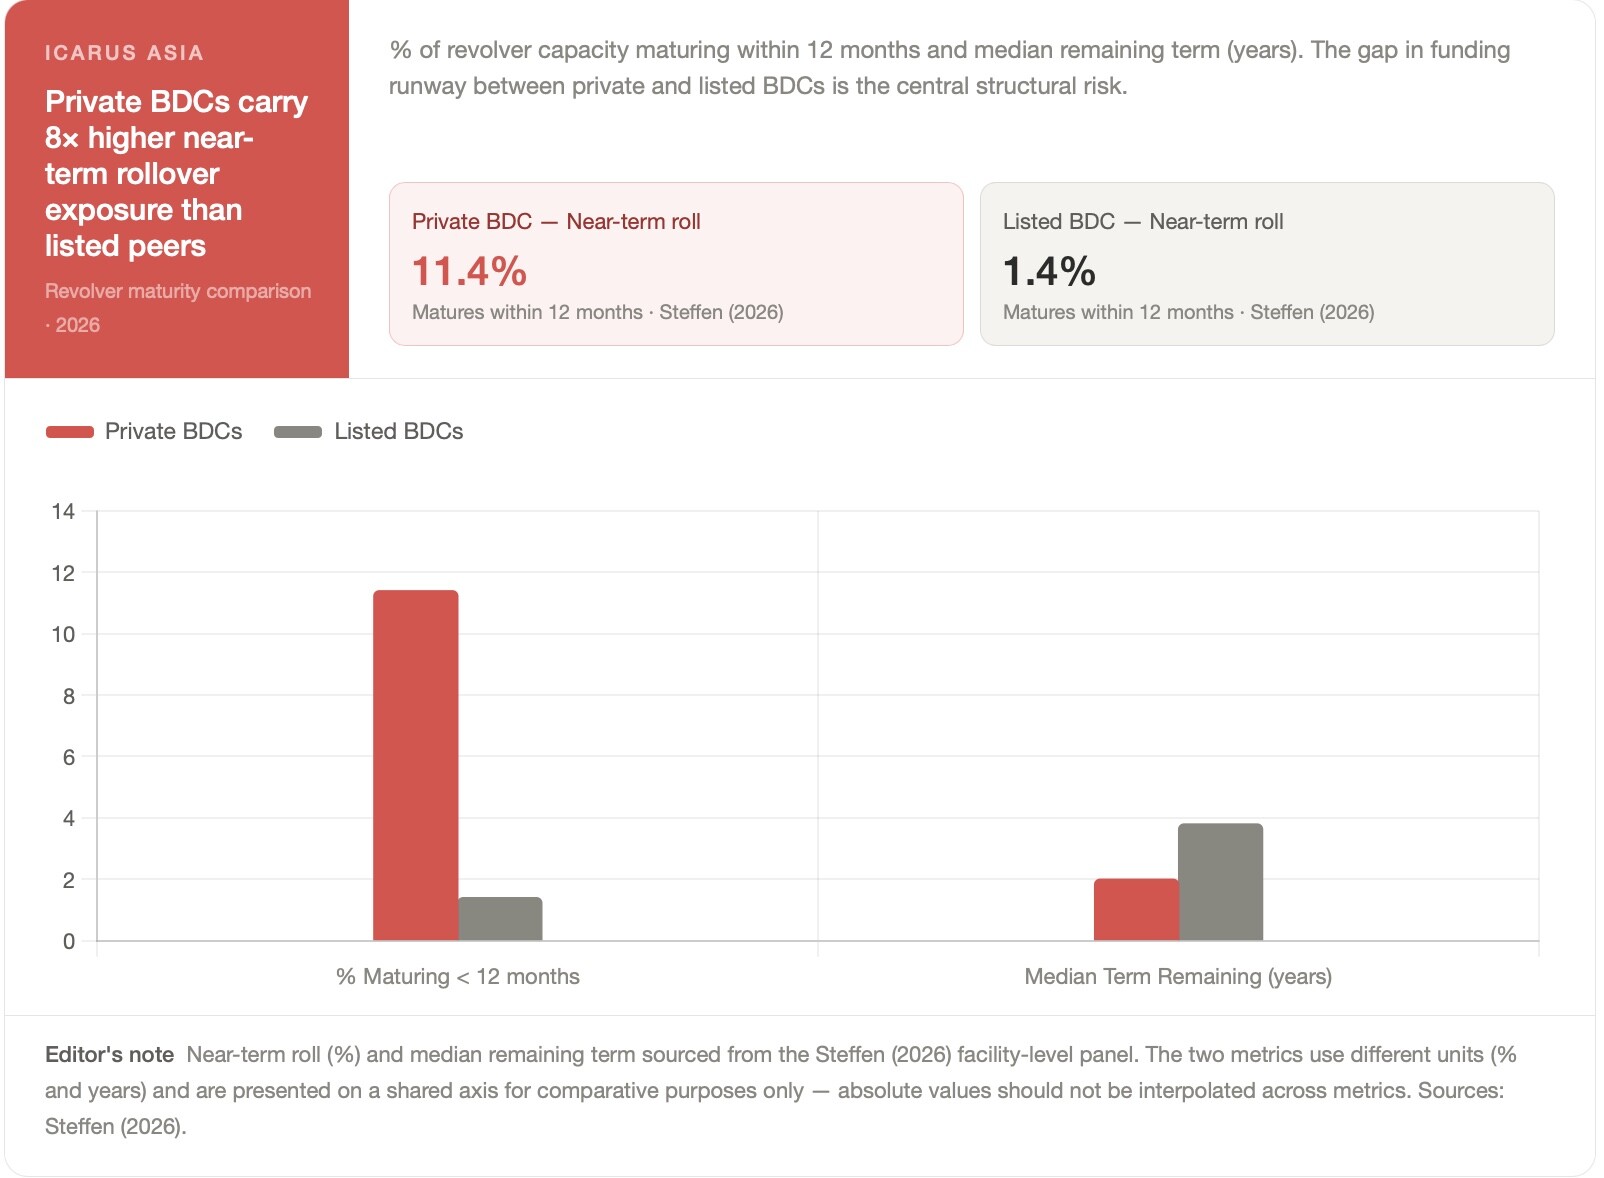
Bernhard Steffen's 2026 facility-level analysis of the BDC sector contains a number that deserves more attention: 11.4% of private BDC revolver capacity matures within the next 12 months. The equivalent figure for listed BDCs is 1.4%. Private BDCs also carry shorter remaining terms on average, about two years versus 3.8 years for their public peers, at comparable spreads.
The concentration problem makes this worse.
Fifteen banks dominate BDC lending, and the top five handle roughly 87% of revolver volume. When a private BDC's revolver comes due, the renegotiation is usually bilateral: one bank, one borrower, no competitive process. Banks have used that position before.
The Bond Wall
The sector's move into unsecured bonds was supposed to fix the revolver problem. For a while, it did.
BDCs issued enough unsecured debt over the past three years to grow that pool from roughly $2.4 billion in 2023 to approximately $18.1 billion today. Seven times in three years. Private BDC exposure to this funding channel concentrates in the 2028-2030 maturity window.
Unlike revolvers, unsecured bonds can't be quietly renegotiated over a phone call. They require public-market access, which closes in risk-off periods. If spreads are wide when those bonds come due (and they may be), refinancing costs rise, lending capacity shrinks, and the returns that attracted investors look considerably different than the brochure suggested.
Faced with redemption queues that outstripped gate caps, the larger platforms did the rational thing: they borrowed more. Across the top 10 private BDCs, total funding stacks grew approximately 46% over the past 12 months. Warehouse line utilization climbed from 63% to 76%.
This lets platforms honor redemptions without selling loans at distressed prices, which protects reported NAV in the short run. The cost is higher dependence on banks and CLO counterparties, the ones whose behavior becomes hardest to predict in a stress scenario.
This lets platforms honor redemptions without selling loans at distressed prices, which protects reported NAV in the short run.
Three platforms managed redemptions better than peers.
Blackstone Private Credit Fund, Oaktree Strategic Credit Fund, and Monroe Capital Income Plus honored requests at or above the 5% gate cap. Others cut pro-rata, queued investors, and said they'd try again next quarter.
NAV: The Range Hiding Inside the Average
Asset-side pressure compounds the funding problem. In a sample of 32 BDCs, 27 posted NAV declines. Non-traded platforms averaged -1.7%. Listed peers averaged -3.8%. Monroe came in at approximately -4.8%. Main Street Capital and Golub held roughly flat.
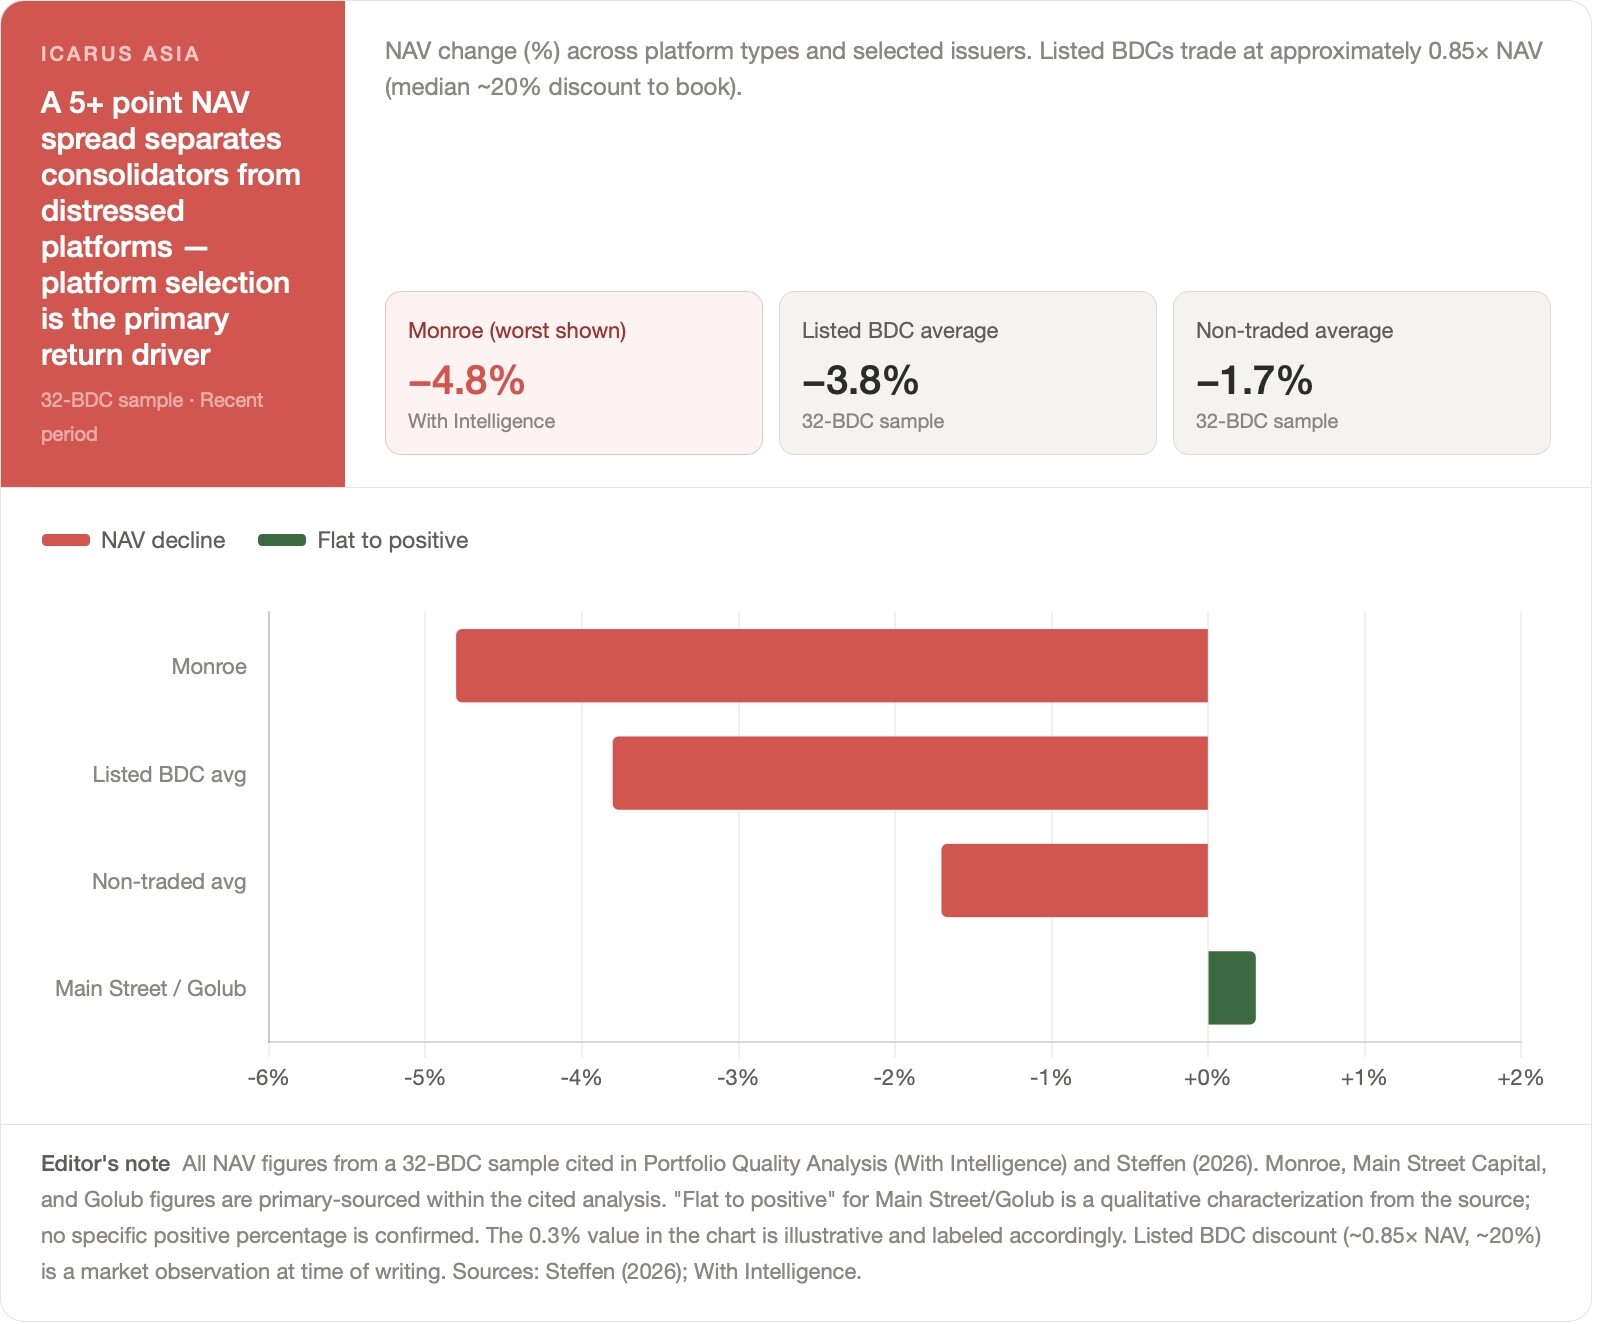
The spread between those outcomes, more than five percentage points across a single asset class, matters more than the averages do. Private credit investors who allocated to the sector as an asset class received very different results depending on which platform they picked. That spread was always the right question. Most people didn't ask it.
Listed BDCs now trade at about 0.85 times book, implying average discounts of 15 to 20%. That's the market's estimate of what the reported NAV is worth in a world where funding structure matters and liquidity has a price.
Software, PIK, and the Concentration That Got Baked In
Non-traded BDCs carry approximately 19.7% in direct software exposure, rising to about 35.6% when healthcare technology and adjacent IT exposure is included. That concentration reflects late-cycle vintage risk: the loans written at the peak were often in the sectors growing fastest.
PIK income, interest that accrues rather than gets paid in cash, averages about 4.6% across non-traded BDCs. For tech-heavy vehicles, it runs above 10%. Post-origination PIK, where a borrower amends its loan to defer cash interest, is usually a strain signal. PIK structured at origination is a different instrument entirely.
Moody's moved its BDC sector outlook to negative this year. BDC fundraising fell 40% year on year and the sector recorded its first net outflows. Investors leaving are repricing liquidity. Predicting collapse is a different decision, and the platforms that understand the distinction are already preparing differently.
Where This Leaves Investors
Most of these platforms survive. Some of them (the ones with strong borrower diversification, long-dated and diversified funding, disciplined PIK management, and internally aligned management teams) are positioned to gain share. They can provide liquidity when competitors can't.
The rest face a different path: higher refinancing costs, shrinking lending capacity, pro-rata redemption queues, and quarterly NAV marks that leave everyone guessing what the book is actually worth.
Pick the platform before you pick the asset class. Ares Capital, Blackstone Secured Lending, and Main Street Capital sit at one end of the distribution. Smaller, more concentrated, more aggressively funded vehicles sit at the other. The distance between them is wider than the category average suggests.
At 15 to 20% discounts to NAV, the listed fortress names offer something the broader sector doesn't: a known entry price and a margin of safety that non-traded vehicles, with their quarterly marks, can't quite claim.
The author is the Head of Research and Analysis at Icarus Asia, a risk and advisory firm based in Hong Kong.
This article is drawn from Icarus Asia's June 2026 research report, "The Private Credit Wall: Liquidity Normalization, Funding-Structure Risk, and Platform Bifurcation."
The full analysis, including the Platform Quality Score framework and BDC Bifurcation Matrix is available on our website after registration.
For institutional and professional investors only. Not investment advice.