
News · Credit · Global
BlackRock Fund Gates Redemptions as Investor Exodus Hits Private Credit
HPS Corporate Lending Fund capped withdrawals at 5% after exit requests nearly doubled the limit
BlackRock's HPS Corporate Lending Fund turned away roughly half its would-be sellers in the first quarter of 2026, enforcing a withdrawal cap for the first time in its four-year history after investors asked to pull nearly double what the fund's rules allow.
The fund, known as HLEND, received redemption requests covering approximately 9.3% of shares outstanding as of Dec. 31, 2025, according to a letter to shareholders. Under the terms investors agreed to when they bought in, the fund needed to only honor 5% of redemption requests per quarter. And it did exactly that, returning roughly US$620 million while holding the rest.
HLEND markets itself as bringing institutional direct lending to individual investors, a product pitch that has attracted billions from retail buyers who want the yield of private debt without the US$10 million minimums of a proper fund. The trade-off has always been liquidity: investors get quarterly exit windows capped at 5% of shares. In 18 prior quarters, demand never hit that ceiling. In the first quarter of 2026, it blew past it.
"Historically, periods of uncertainty and volatility have created some of the most compelling investment opportunities within private credit markets," the fund wrote to shareholders. "We believe that we are entering into that type of environment."
That framing of gating the exits, or framing it as opportunity, seems to be a lot of work. Perhaps justified given how much HLEND charges.
When “Inception” meets money management
HLEND charges a 1.25% management fee on net assets and a 12.5% incentive fee, subject to a 5.0% hurdle rate with a catch-up on the income portion.
But that's only part of the picture. The full fee schedule by share class looks like this, starting with upfront placement fees of up to 2% for Class I, D and F shares, and up to 3.5% for Class S shares. Annual shareholder servicing or distribution fees then run at zero for Class I, 0.25% for Class D, 0.50% for Class F, and 0.85% for Class S.
That by itself doesn’t paint the full picture.
If one adds everything together, the management fee, incentive fee, interest expense on borrowed funds, servicing fees, plus operating costs like legal, audit, custody and administration and the total annual fund expenses, including interest expense, then total annual fund expenses are 10.5% for Class I, 10.8% for Class D, 11% for Class F, and 11.4% for Class S. Excluding interest expense, those figures drop to 1.6%, 1.8%, 2.1%, and 2.4% respectively.
The 10% plus "total including interest" number is real but somewhat misleading without context. It includes the cost of the fund's own borrowed money used to amplify returns, not purely fees paid to the manager. The more meaningful investor cost is the ex-interest figure.
But even that deserves scrutiny.
The Layer Problem
Here's where it gets uncomfortable. HLEND doesn't invest directly in loans as a standalone entity. It is a fund of loans managed by HPS, which is itself now owned by BlackRock. The investor is therefore paying:
Layer 1: HLEND fund-level costs (ex-interest): 1.6% to 2.4% per year, depending on share class, every year the money is invested.
Layer 2: Incentive fee drag: 12.5% of net investment income above the 5% hurdle. If HLEND earns 10% gross on its portfolio, the income above 5% is $50 per US$1,000 invested and 12.5% of that (US$6.25) goes to HPS before the investor sees it. At the stated 10.7% annualized return, this is not trivial.
Layer 3: Entry cost: Up to 3.5% upfront for Class S, 2% for other classes. That's a permanent drag on Day 1. An investor putting in US$100,000 in Class S shares starts with an effective investment value of US$96,500 before earning a cent.
Layer 4: Early exit penalty: Shares not held for at least one year are subject to a 2.0% early repurchase deduction. So if you put money in, then need it back within 12 months, you lose another 2% on the way out.
So what does US$100,000 invested actually cost over time?
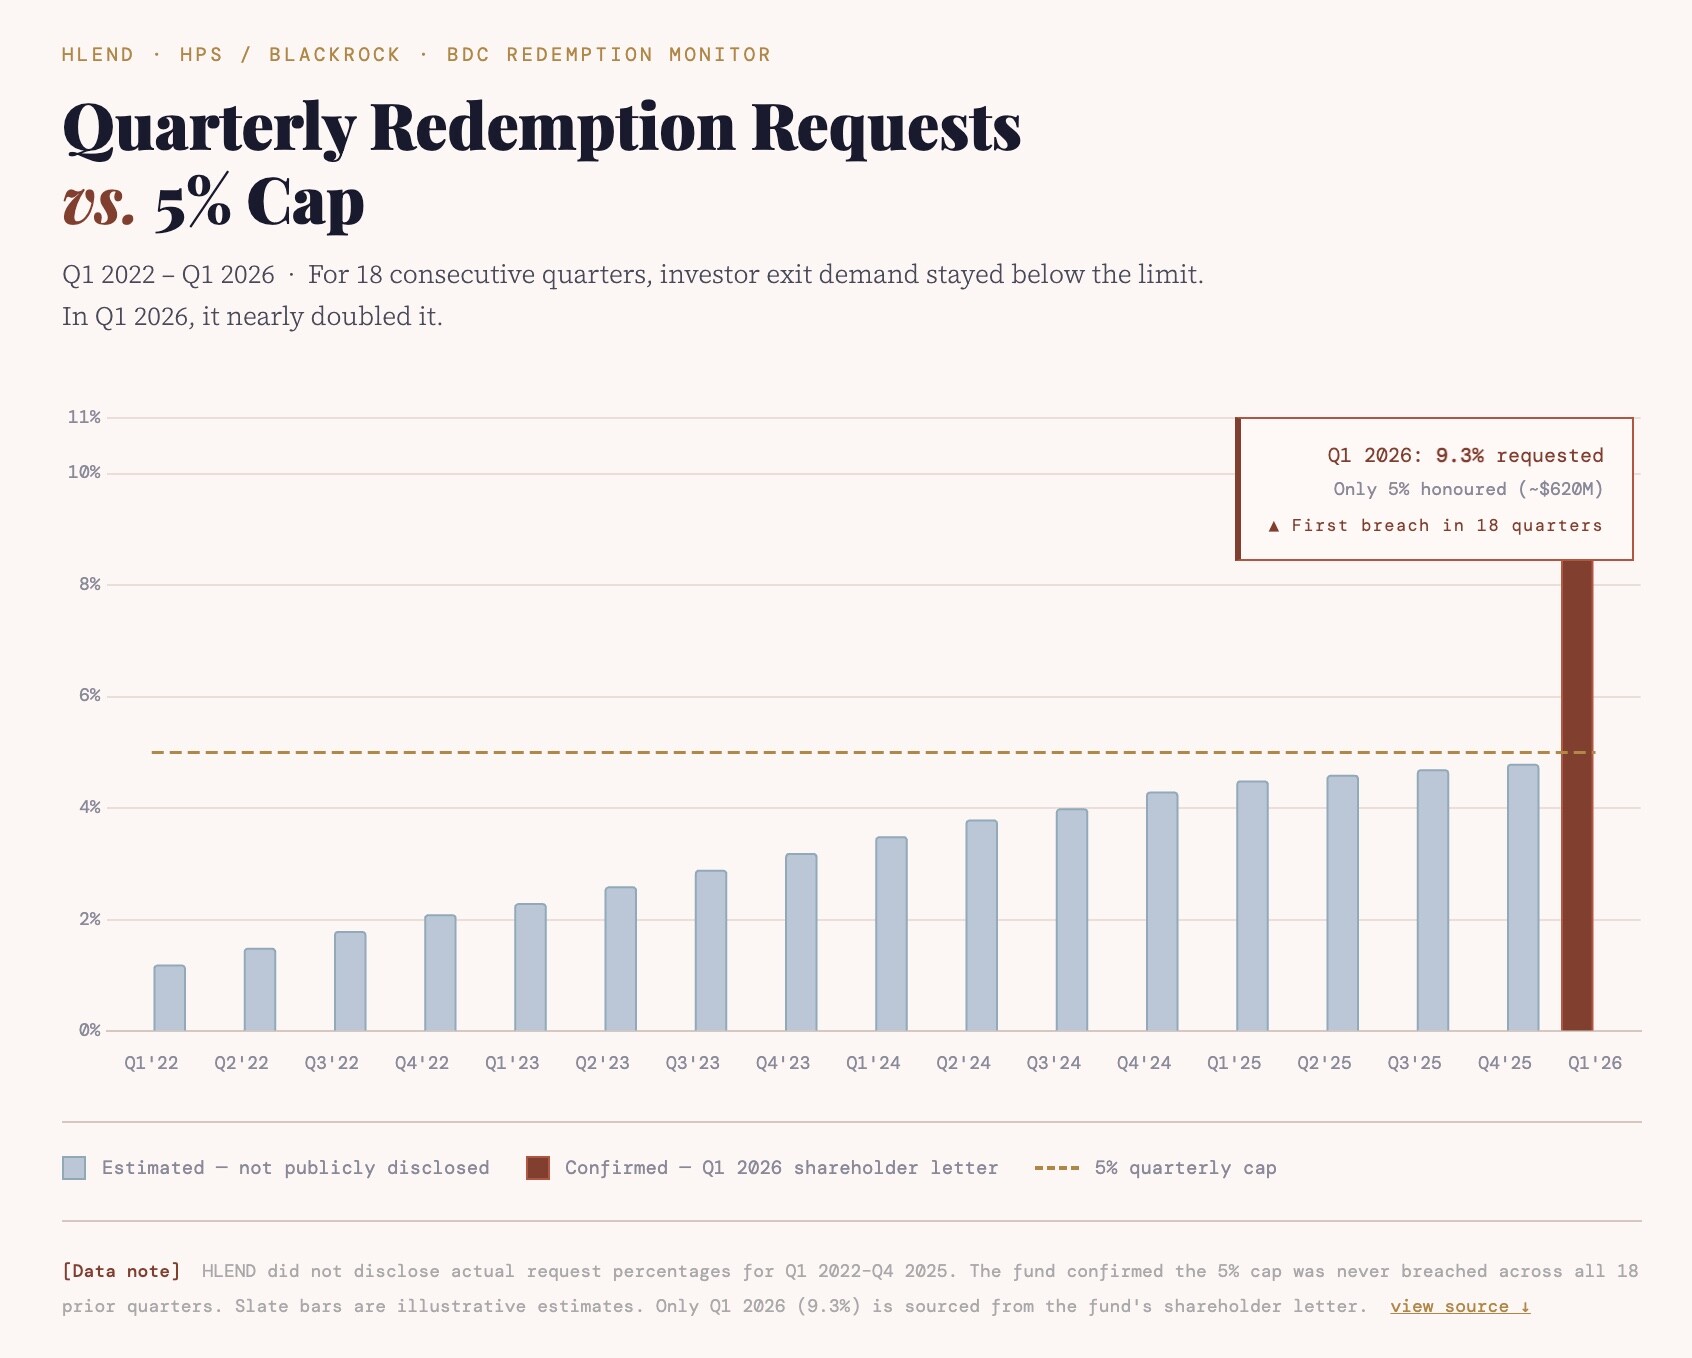
Note: HLEND’s own March 6, 2026 shareholder letter/8‑K explicitly says this was the first time redemption requests exceeded the 5% framework since launch four years earlier.
Using Class S (the retail-facing class, most widely distributed) and Class I (the institutional class, used as the benchmark for the 10.7% return figure), here is the math assuming US$100,000 is invested, the gross portfolio yields 10.7% on an annualized basis (as stated) and the incentive fee kicks in above the 5% hurdle rate. And mind you, this is not including the capital gains component.
For Class I shares held over five years:
Right upfront, the entry cost of US$2,000 or 2% placement fee, means your effective starting capital would be US$98,000. Add to that annual ex-interest expenses or 1.6% on the NAV, compounding annually.
Add to that an incentive fee or 12.5% on income above the 5% hurdle, so roughly 12.5%* (10.7%-5%) or an approximately 0.71% additional annual drag. So total annual drag ex-interest: approximately 2.3%.
That amounts to a net return to investors or about 10.7%-2.3% or around approximately 8.4% per year. On that US$98,000 starting capital over five years at 8.4% you would ideally end up with about US$146,300. Without any fees, your initial US$100,000 growing at 10.7% for five years would grow to approximately US$165,800. With the drag from the fees over five years you would be short of roughly US$19,500, or about 11.7% of your starting capital.
For Class S shares held over five years:
Entry cost: The entry cost of US$3,500 means your starting capital sits at US$96,500. With annual ex-interest expenses at 2.43% and an incentive fee drag or about 0.7% your total annual expenses would amount to about 3.1%. Assuming a net return of about 7.6% per year (10.7%-3.14%) you would end up with about US$138,600 for five years. So in essence, fees would have cost you 16.4% of your or roughly US$27,200 over five years against a no-fee scenario.
(Disclosure and inference: These calculations use disclosed fee rates and stated fund returns applied as constants. Actual outcomes will differ based on portfolio performance, leverage, and incentive fee calculations in any given period.)
What HLEND Doesn't Disclose in the Letter
The investor letter cites the 10.7% return as a headline.
That figure is a total net return or essentially returns already after management fees and operating expenses. The denominator used to calculate total annual fund expenses is based on estimated average net assets of US$7.0 billion for the fiscal year ending December 31, 2024. As the fund grows, fee percentages stay fixed but the absolute dollar amounts extracted by the manager rise proportionally.
The letter also doesn't mention that distributions may be funded from sources including the sale of assets, borrowings, return of capital or offering proceeds, and the fund has no limits on the amounts it may pay from such sources. If distributions are partly a return of capital, you're getting your own money back and paying a 10% plus total expense ratio on it in the process.
The honest summary? The 10.7% is real on paper, the fees are real in cash, and the two exist simultaneously.
The question for any investor is whether the net return after all layers--entry costs, annual expenses, incentive fees, and a potential exit deduction--justifies holding an illiquid instrument where the manager decides when and whether you can leave.
What the HLEND Letter Says
The fund's headline numbers hold up under scrutiny, at least on the surface.
HLEND reported a 10.7% annualized total net return since its February 2022 inception, 96% first-lien debt exposure, a 39% weighted average loan to value, and US$4.4 billion in available liquidity as of Feb. 28. Leverage sits at 1.0x debt to equity, the low end of its 1.0x to 1.25x target. Portfolio companies grew earnings before interest, tax, depreciation and amortization (EBITDA) 15% on a weighted average basis over the past year. Interest coverage averaged 2.2x.
On paper, a fund in good health telling skittish investors not to panic.
What the Footnotes Say
The disclosures run three dense pages and contain language that should give any investor pause before accepting the headline figures at face value.
The net asset value (NAV) figure used to price redemptions is calculated from "unaudited data and valuations of the underlying investments," which are described as "estimates of fair value." Those estimates "may not accurately reflect the price at which assets could be liquidated." The fund's own footnotes say so.
Portfolio company credit statistics, including the 2.2 times interest coverage ratio, are "derived from the most recently available portfolio company financial statements" and are "generally about 90 days in arrears." The fund makes "no representation or warranty" in respect of that data.
The earnings before interest, tax, depreciation and amortization (EBITDA) and loan-to-value figures, the numbers that anchor the portfolio's apparent health, exclude "investments on non-accrual status as of December 31, 2025." Non-accrual means the borrower has stopped paying. Those loans don't disappear. They just don't appear in the metrics the letter leads with.
The interest coverage calculation also excludes non-accrual loans, as well as "restructured debt and equity." Strip out the problem assets and the remaining book looks cleaner. That's commendable cherry picking when it comes to math, not performance.
The PIK Problem
The letter makes no mention of payment-in-kind loans, a standard feature of private credit portfolios where borrowers who can't meet cash interest obligations roll the unpaid amount onto their principal balance instead. PIK loans keep borrowers technically current while the debt quietly grows. They are disclosed in BDC filings but not flagged in investor letters.
In the private credit industry, this mechanism--where deferred or defaulted interest obligations accrete back onto original principal--is sometimes called principal onto original principal, a structure that lets a fund report performing loans and stable NAV even as the underlying cash economics deteriorate.
(Note: This is based on standard BDC documentation practices and the fund's disclosure exclusions. The fund does not use this terminology.)
HLEND's prospectus acknowledges the risk plainly: the fund "may fund such distributions from sources other than cash flow from operations, including, without limitation, the sale of assets, borrowings, return of capital or offering proceeds." There are "no limits on the amounts" it may draw from those sources. Distributions since inception have been funded from net investment income, according to the letter but the door to other sources is open and the fund says so.The Asymmetry
The same quarter HLEND gated US$620 million in redemptions, it took in roughly US$840 million in new subscriptions. Money flows in on the first of every month. It exits quarterly, capped, at a price set by the manager using unaudited, lagged data.
Investors who submitted unfulfilled redemption requests were told those requests don't carry over automatically. They'll need to resubmit next quarter, if they want to try again, and compete with whoever else is in line.
The fund raised its liquidity figure to US$4.4 billion in its opening paragraph. That number includes undrawn revolving credit capacity, not just cash. It's a real number, but it measures the fund's ability to make new loans or meet margin calls, not its ability to pay out every investor who wants to leave.
Private credit has grown to a $2 trillion asset class on the back of a pitch that institutional-quality returns are now accessible to individuals. The product works when rates are high and defaults are low. The test comes when investors want their money back at the same time.
HLEND just ran that test. Half the sellers are still waiting.
Note: This is not investment or legal advice. Please do your own research.
Notes:
This analysis is based solely on the Q1 2026 client repurchase letter issued by HPS Corporate Lending Fund and its accompanying disclosure documents. It is not investment advice.
PIK and principal-accretion references are analytical observations drawn from standard BDC mechanics and the fund's own disclosure language; they are not direct admissions by HLEND.
All performance figures are unaudited, class-specific, and subject to the disclosures in the fund's prospectus available at sec.gov and HLEND.com.
Readers are encouraged to specifically read the footnotes 1, 3, 7, 8, and 11 in HLEND's prospectus.
HLEND is a non-traded BDC registered with the SEC.