
News · Markets · Global
Bezos Says the AI Trade Is Fine. A Veteran Market Analyst Has Seen This Before.
A veteran market analyst maps the parallels between 2026's AI rally and the dot-com peak of 2000 -- and explains why the differences don't fully close the gap.
A veteran market analyst maps the parallels between 2026's AI rally and the dot-com peak of 2000 -- and explains why the differences don't fully close the gap.
Jeff Bezos, whose net worth is reported at roughly $250 billion, told a CNBC audience last month that investors have no reason to worry about a bubble forming in artificial intelligence. Ron Insana, who has covered financial markets for 42 years, disagrees -- not with the technology, but with the conclusion.
In two recent posts on his Substack newsletter, Insana lays out the case that several indicators preceding previous major market tops have reappeared in the current AI cycle. He is explicit that the parallel is imperfect and that key differences distinguish 2026 from the dot-com peak of 2000.
His argument is that the differences are real but insufficient to dismiss the risk.
The Technology Argument
Insana's starting point is historical.
Each of the major speculative episodes of the past century -- railroads, radio, automobiles, electricity, the internet -- was built on a genuine technological revolution. In each case, Insana writes, "the belief in new technologies overwhelms, at least for a time, its realized potential." The technology proved out. The stocks, in the near term, did not.
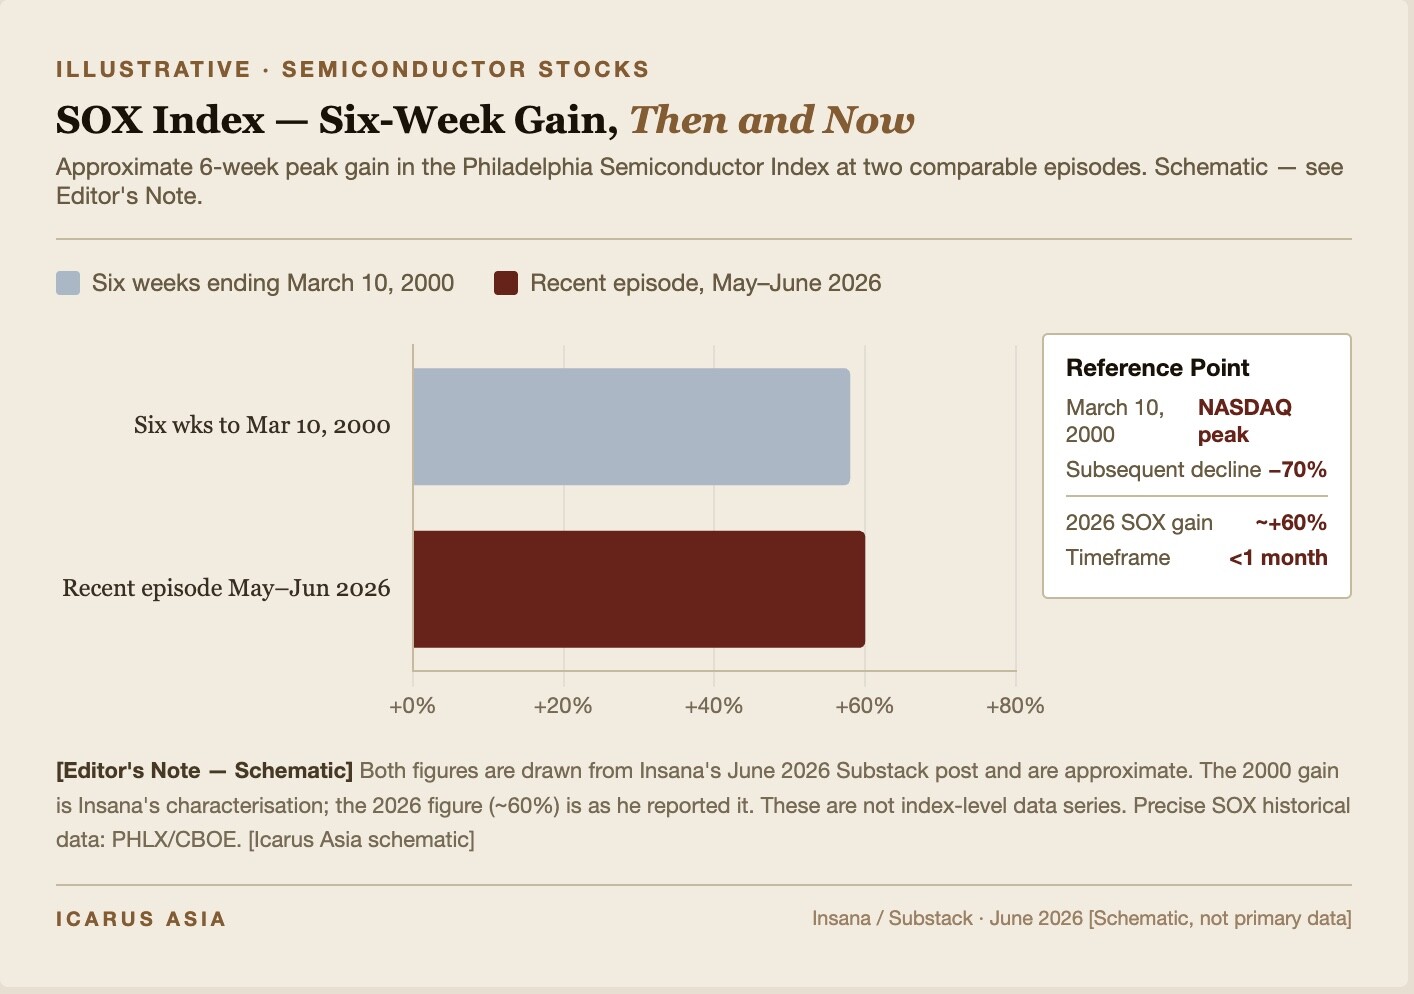
"In 1999, everyone was saying exactly the same thing about the internet," Insana writes. "And, indeed, it did [change the world]. But only after the bubble was deflated." The NASDAQ fell 70% from its March 10, 2000 peak over the following two and a half years.
Structural Parallels
Insana draws three structural comparisons to the current cycle.
First, market concentration.
Five companies -- Micron Technology, Apple, Microsoft, Google, and NVIDIA -- now account for approximately 25% of S&P 500 profits. The weighting of the so-called Magnificent Seven within the index exceeds anything recorded since the late 1990s. Insana compares Nvidia's current position -- a market value approaching $6 trillion -- to Cisco Systems at its 2000 peak of $600 billion: the dominant hardware supplier of a buildout that proved correct in its direction and damaging in its timing for investors who bought at the peak.
Second, capital expenditure.
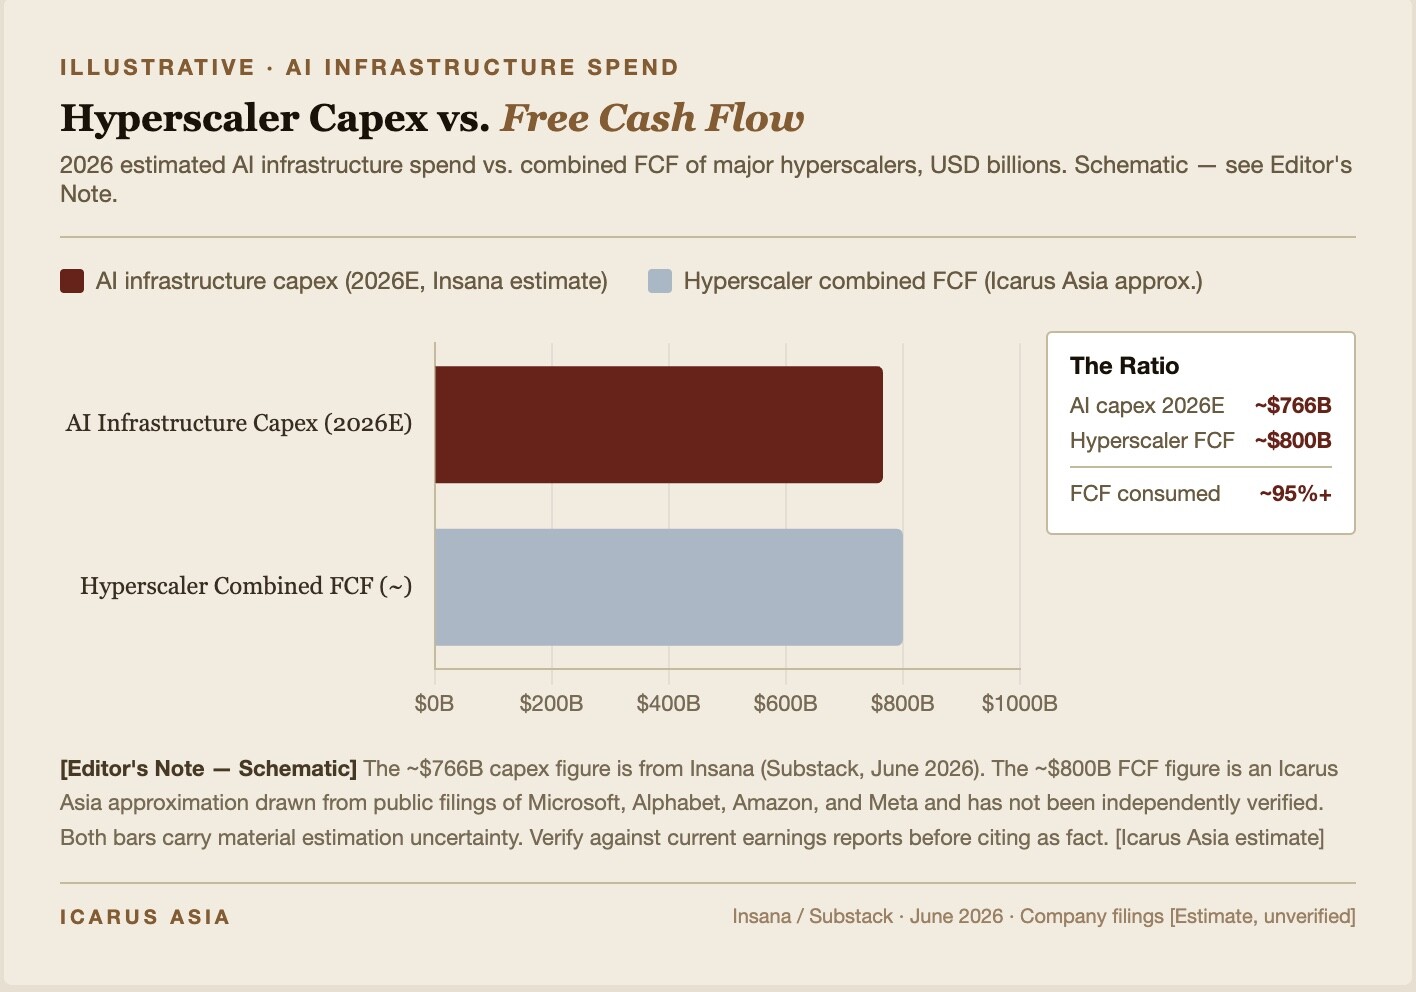
Insana estimates total AI infrastructure spend at roughly $800 billion in 2026, covering data centers, compute, and software. He draws a direct parallel to the fiber-optic buildout of the late 1990s, in which excess capacity was laid that would not be fully utilized for nearly a decade.
He notes that for some hyperscalers, this investment is consuming nearly all free cash flow, while others are reportedly financing the buildout with off-balance sheet debt -- a structure he describes as carrying material risk if AI monetization does not materialize on the expected timeline.
Third, retail participation.
The BofA Global Fund Manager Survey for May 2026, cited by Insana, shows cash allocations at 3.9% -- a level that BofA's own research has historically associated with market corrections or bear markets.
Options market activity reinforces the point.
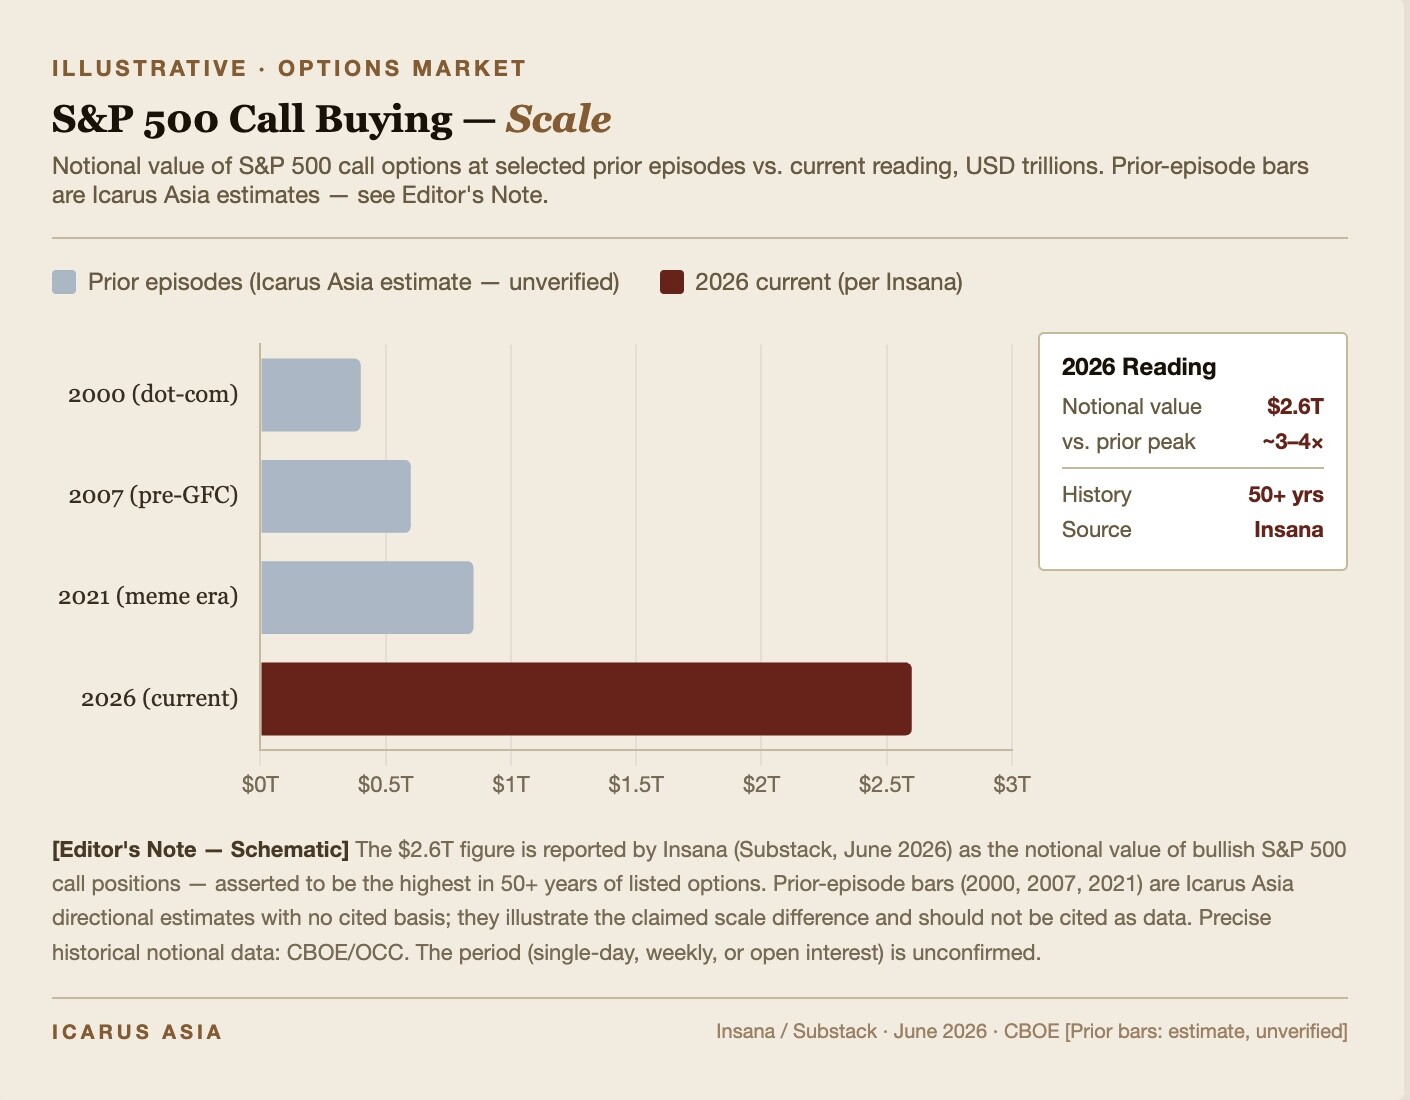
The notional value of bullish call buying on the S&P 500 recently reached $2.6 trillion, which Insana describes as the highest figure in more than 50 years of listed options trading.
Insana also notes deteriorating market breadth: major indexes are at record levels while an increasing number of individual stocks are reaching 52-week lows. He writes that this pattern has appeared far more frequently at cyclical market tops than at bottoms.
Where the Comparison Breaks Down
Insana is direct about the differences.
Current valuations among the dominant AI companies are materially lower than their dot-com counterparts.
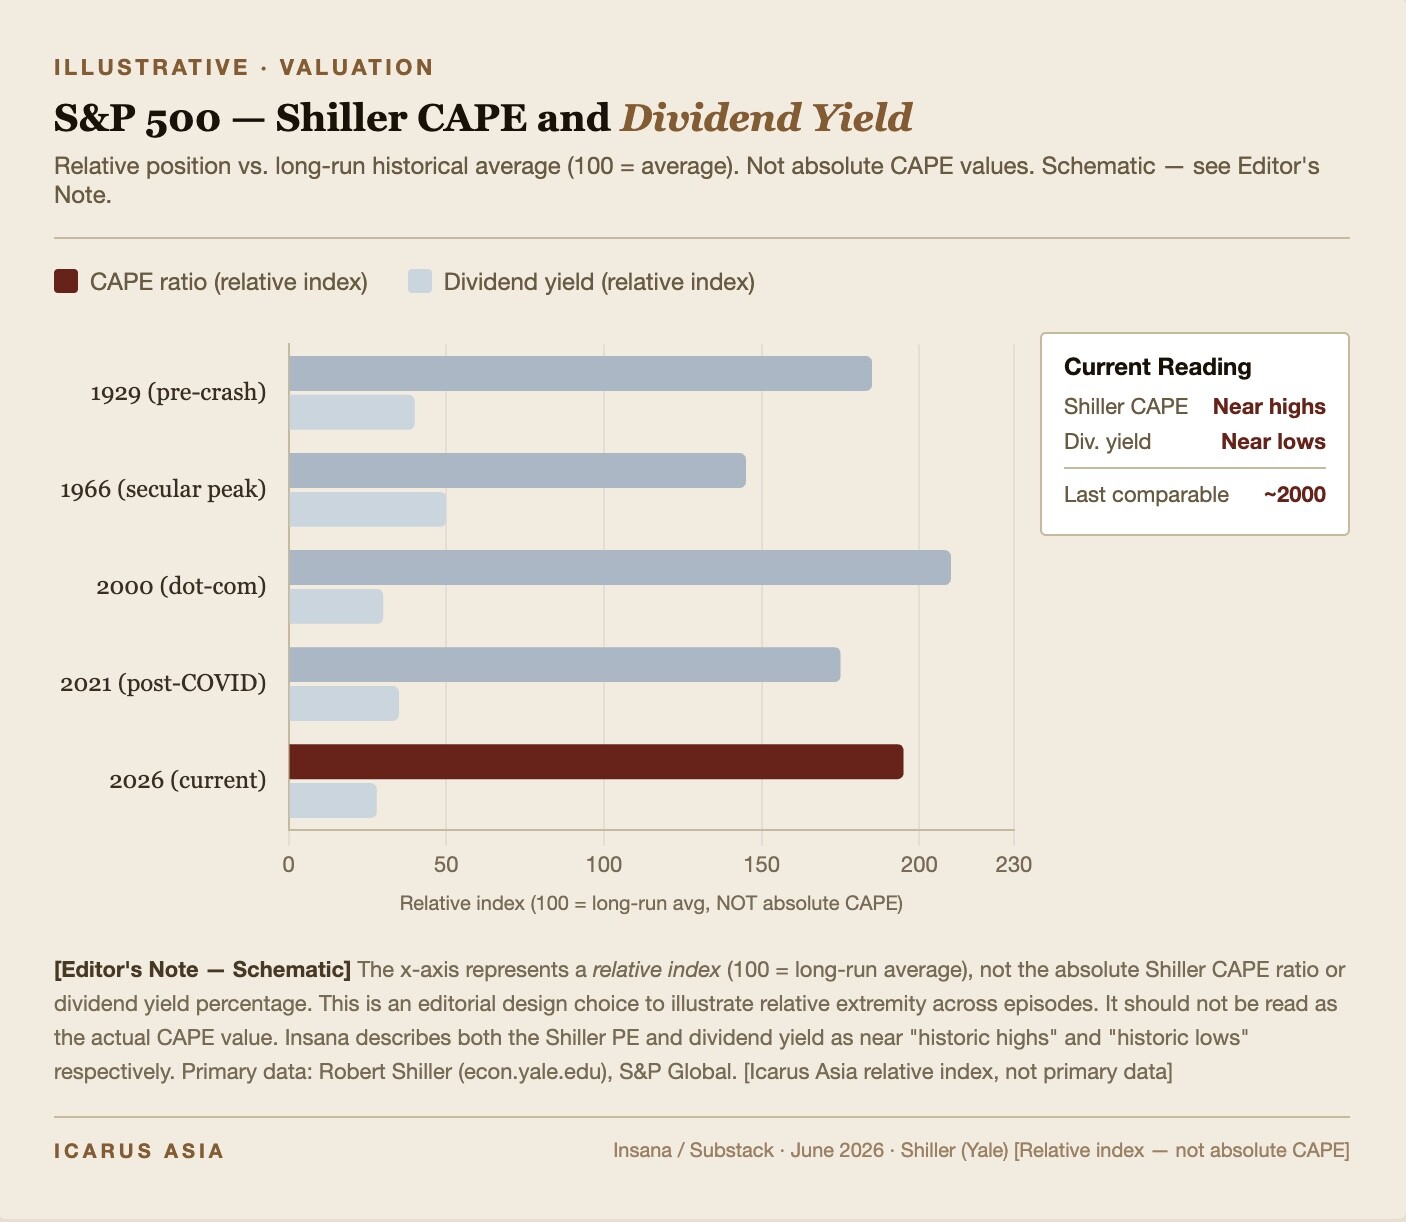
Nvidia trades at roughly 24 times forward earnings; Cisco peaked above 120 times. The NASDAQ's aggregate price-to-earnings ratio is well below the triple-digit levels of 2000. Revenue and earnings growth at today's leading AI companies are real and substantial, in contrast to the dot-com era, when many companies went public without products or sustainable business models.
The IPO supply pipeline is also relatively quieter than it was in 1999. Hundreds of companies went public in that cycle, many without commercial products.
Private capital has funded AI companies at escalating valuations without requiring public listings, keeping that supply off the market.
Insana argues this distinction may be temporary.
SpaceX is reportedly planning a mid-June IPO filing targeting a raise of $75 billion at a reported valuation of $1.75 to $2 trillion -- which, if accurate, would rank among the largest public offerings on record. OpenAI and Anthropic may follow. Insana's analysis suggests that if those mega-offerings succeed, they could catalyze a broader wave of AI company listings, recreating the supply dynamic of 1999. He quotes Bezos himself telling CNBC that nearly every AI idea is currently getting funded. "That," Insana writes, "sounds eerily familiar."
The Federal Reserve
Insana identifies monetary tightening as the common terminal mechanism in every major speculative cycle he has studied. The Fed's rate-hiking campaign of 1999-2000 is credited with triggering the conditions that deflated the internet bubble.
This comes as the new Federal Reserve Board Chair Kevin Warsh has indicated a preference for rate reductions, drawing comparisons to Alan Greenspan's posture during the late-1990s productivity expansion. Warsh cited "trimmed averages" at his confirmation hearing as a reliable guide to underlying inflation, and told Democratic Senator Catherine Senator Catherine Cortez Masto he believes inflation "has improved somewhat in the last year."
That would help Warsh corral agreeable economists, and Fed committee members, towards a low or no-interest rate regime ahead of the midterm elections in the U.S.
Trimmed averages, Warsh's favored inflation measure, came in cool again in April. However economists who publish it warn the reading is understating actual price pressures, complicating Warsh's argument that inflation is improving, according to reporting by Reuters News Agency.
The Dallas Fed's trimmed mean measure of inflation rose 2.3 percent in the 12 months through April, down from 2.4 percent in March, the Federal Reserve Bank of Dallas said on Wednesday.
But the gauge's own creators say that is not what the number means right now.
"You would want to be cautious on getting too much optimism from the level of the trimmed mean," said Tyler Atkinson, an economist at the Dallas Fed, in an interview to Reuters on Wednesday.
Under normal conditions, the measure filters out statistical noise by stripping away the fastest-rising and fastest-falling prices. In April, those included surging costs for gasoline, airfare and jewelry alongside falling prices for poultry, household linens and haircuts. What remains is meant to capture a representative middle band of price changes that reliably signals where inflation is headed.
Under normal conditions, the measure filters out statistical noise by stripping away the fastest-rising and fastest-falling prices. In April, those included surging costs for gasoline, airfare and jewelry alongside falling prices for poultry, household linens and haircuts.
The complication, Insana writes, is that current inflation data runs counter to the case for cuts. Commodity prices, including energy, fertilizer, and helium, are rising and financial markets are at present pricing in a higher probability of a rate increase by year-end than a cut.
The tension between a policy preference for easing and data that may compel tightening sits at the center of Insana's forward risk framework.
Insana's Position
Insana does not claim to be calling a market top.
His analysis notes that Bob Farrell, one of Wall Street's most respected technical analysts, warned of excessive valuations in 1998, approximately 18 months before the NASDAQ peaked. Investors who acted on that warning early missed substantial gains before being proven correct. Insana frames his own analysis as pattern recognition rather than prediction.
Bull markets and bubbles all end the same way. That's not opinion. That's history. -- Ron Insana
The conditions he maps -- concentrated earnings, record options positioning, deteriorating breadth, capital expenditure that outpaces near-term monetization, and a central bank facing conflicting pressures -- do not in themselves constitute a sell signal. They constitute a case for what Insana calls protecting one's portfolio while participating in the rally.
Bezos's advice is to stay in. Insana's is to stay in carefully.
The author is the Head of Research and Analysis for Icarus Asia, a Hong Kong-based risk and advisory business.
Sources:
Ron Insana, What I'm Watching So You Don't Have To -- May 20, 2026 and May 12, 2026. Substack.
Charts: Icarus Asia (schematic and illustrative).
Advisory disclaimer
This article is market commentary and does not constitute investment advice. Please do your own investment research or consult with a registered financial advisor for advice.
Legal disclaimer
This article is a work of commentary, not reported news. It synthesizes and annotates analysis published by Ron Insana on his Substack newsletter, What I'm Watching So You Don't Have To.
All factual claims, market observations, and data points cited herein originate with Insana's published commentary unless separately attributed. The publication of this commentary by Kenan Machado and Icarus Asia has not independently verified those underlying figures.
The five charts accompanying this article are schematic and illustrative. They are constructed to visualize the directional arguments made by Insana in the referenced posts. They do not represent primary-source data series. Specific limitations are disclosed in the Editor's Note appended to each chart. Readers requiring precise index-level, options-market, or earnings data should consult the primary sources cited in those notes.
This article represents the views attributed to Ron Insana and does not constitute investment advice. This article is in a series of market research and commentary by Kenan Machado.